
• Cart
    • Quote
    • Enquiry
    • Cart
    • Quote
    • Enquiry
Novogene Europe
  • Novogene Europe
  • Genomics
    • Human Whole Genome Sequencing
    • Whole Exome Sequencing
    • Plant and Animal Whole Genome Sequencing
    • Plant and Animal De novo Sequencing
    • Microbial Whole Genome Sequencing
    • Microbial De novo Sequencing
    • Whole Plasmid SequencingOrder Online!
    Proteomics
    • Olink ProteomicsNew!
    Epigenomics
    • DNA Methylation SequencingUpdated!
    • Chromatin Immunoprecipitation Sequencing (ChIP-seq)
    • RNA Immunoprecipitation Sequencing (RIP-seq)
    Metabolomics
    • Untargeted MetabolomicsComing Soon!
    Transcriptomics
    • mRNA Sequencing
    • Small RNA Sequencing (sRNA‑seq)
    • Circular RNA Sequencing (circRNA-seq)
    • Total RNA Sequencing
    • Whole Transcriptome Sequencing
    • Full-Length Transcriptome Sequencing
    • Prokaryotic RNA Sequencing
    • Metatranscriptome Sequencing
    Metagenomics
    • Amplicon SequencingOrder Online!
    • Shotgun Metagenomics Sequencing
    Single Cell & Spatial Omics
    • 10X Single Cell Gene Expression
    • 10X Single Cell Immune Profiling
    • 10X Visium HD Spatial Gene Expression
    Premade Library
    • Sequencing Only on Illumina® Sequencer
    • Sequencing Only on Element SequencerNew!
    • Sequencing Only on PacBio Sequencer
    Translational Research
    • Accredited & Validated Clinical Research Sequencing
  • PromotionsPromotions
    • Platforms
    • Automated Delivery Platform (Falcon)
    • Bioinformatics Analysis Tool (NovoMagic)
    • Customer Service System (CSS)
    • Customer Support
    • Webinars
    • Case Study
    • Blog
    • Brochure
    • Cancer Research
    • Immuno-oncology
    • Agrigenomics
    • Environment
    • Food Science
    • Human Microbiome
    • Plant and Animal Microbiome
    • Drug Discovery and Development
    • Rare and Complex Diseases
    • About Us
    • News & Events
    • Careers
    • Our Locations
  • Contact UsContact Us
    • Amplicon Sequencing
    • Whole Plasmid Sequencing

ServicesServices menu

ResourcesResources menu

SupportSupport menu

CompanyCompany menu

Services
Human Whole Genome SequencingWhole Exome SequencingPlant and Animal Whole Genome SequencingPlant and Animal De novo SequencingDNA Methylation SequencingmRNA SequencingFull-Length Transcriptome SequencingWhole Transcriptome SequencingMetatranscriptome SequencingShotgun Metagenomics SequencingAmplicon SequencingWhole Plasmid Sequencing10X Single Cell Gene Expression10X Single Cell Immune Profiling10X Visium HD Spatial Gene ExpressionOlink ProteomicsUntargeted MetabolomicsAccredited & Validated Clinical Research Sequencing
Resources
WebinarsCase StudyBlogBrochure
Support
PlatformBioinformatics Analysis Tool (NovoMagic)Customer Service System (CSS)Customer Support
Company
About UsNews & EventsLocationContact Us
LinkedInLinkedIn hoverYouTubeYouTube hoverInstagramInstagram hoverXX hover
Copyright © 2026 Novogene Inc. All rights reserved.For Research Use Only. Not for Clinical Diagnostic Use.
    • Cart
    • Quote
    • Enquiry
    • Cart
    • Quote
    • Enquiry
Novogene Europe
  • Novogene Europe
  • Genomics
    • Human Whole Genome Sequencing
    • Whole Exome Sequencing
    • Plant and Animal Whole Genome Sequencing
    • Plant and Animal De novo Sequencing
    • Microbial Whole Genome Sequencing
    • Microbial De novo Sequencing
    • Whole Plasmid SequencingOrder Online!
    Proteomics
    • Olink ProteomicsNew!
    Epigenomics
    • DNA Methylation SequencingUpdated!
    • Chromatin Immunoprecipitation Sequencing (ChIP-seq)
    • RNA Immunoprecipitation Sequencing (RIP-seq)
    Metabolomics
    • Untargeted MetabolomicsComing Soon!
    Transcriptomics
    • mRNA Sequencing
    • Small RNA Sequencing (sRNA‑seq)
    • Circular RNA Sequencing (circRNA-seq)
    • Total RNA Sequencing
    • Whole Transcriptome Sequencing
    • Full-Length Transcriptome Sequencing
    • Prokaryotic RNA Sequencing
    • Metatranscriptome Sequencing
    Metagenomics
    • Amplicon SequencingOrder Online!
    • Shotgun Metagenomics Sequencing
    Single Cell & Spatial Omics
    • 10X Single Cell Gene Expression
    • 10X Single Cell Immune Profiling
    • 10X Visium HD Spatial Gene Expression
    Premade Library
    • Sequencing Only on Illumina® Sequencer
    • Sequencing Only on Element SequencerNew!
    • Sequencing Only on PacBio Sequencer
    Translational Research
    • Accredited & Validated Clinical Research Sequencing
  • PromotionsPromotions
    • Platforms
    • Automated Delivery Platform (Falcon)
    • Bioinformatics Analysis Tool (NovoMagic)
    • Customer Service System (CSS)
    • Customer Support
    • Webinars
    • Case Study
    • Blog
    • Brochure
    • Cancer Research
    • Immuno-oncology
    • Agrigenomics
    • Environment
    • Food Science
    • Human Microbiome
    • Plant and Animal Microbiome
    • Drug Discovery and Development
    • Rare and Complex Diseases
    • About Us
    • News & Events
    • Careers
    • Our Locations
  • Contact UsContact Us
    • Amplicon Sequencing
    • Whole Plasmid Sequencing

ServicesServices menu

ResourcesResources menu

SupportSupport menu

CompanyCompany menu

Services
Human Whole Genome SequencingWhole Exome SequencingPlant and Animal Whole Genome SequencingPlant and Animal De novo SequencingDNA Methylation SequencingmRNA SequencingFull-Length Transcriptome SequencingWhole Transcriptome SequencingMetatranscriptome SequencingShotgun Metagenomics SequencingAmplicon SequencingWhole Plasmid Sequencing10X Single Cell Gene Expression10X Single Cell Immune Profiling10X Visium HD Spatial Gene ExpressionOlink ProteomicsUntargeted MetabolomicsAccredited & Validated Clinical Research Sequencing
Resources
WebinarsCase StudyBlogBrochure
Support
PlatformBioinformatics Analysis Tool (NovoMagic)Customer Service System (CSS)Customer Support
Company
About UsNews & EventsLocationContact Us
LinkedInLinkedIn hoverYouTubeYouTube hoverInstagramInstagram hoverXX hover
Copyright © 2026 Novogene Inc. All rights reserved.For Research Use Only. Not for Clinical Diagnostic Use.
banner laptop bg
banner mobile bg

mRNA Sequencing

Poly(A)-selected short-read mRNA sequencing for genome-wide gene expression analysis across eukaryotic samples and conditions.
OverviewOverview
BenefitsBenefits
ApplicationsApplications
SpecificationsSpecifications
ResourcesResources

mRNA sequencing, also known as mRNA-seq, profiles polyadenylated messenger RNA using short-read sequencing to measure gene expression across tissues, cell populations or experimental conditions. It provides a quantitative, genome-wide view of transcriptional activity, supporting differential expression analysis, pathway interpretation and functional genomics research.


Novogene Europe supports poly(A)-selected mRNA-seq projects using Illumina paired-end sequencing, established quality control and bioinformatics workflows for gene expression quantification, differential expression analysis, alternative splicing analysis and functional enrichment. The service can support studies across disease research, development, treatment response, biomarker discovery and broader multi-omics research.

Service Highlights

Poly(A)-selected mRNA Profiling

Profile polyadenylated messenger RNA using short-read sequencing to quantify coding transcript expression across eukaryotic samples and conditions.

Poly(A)-selected mRNA Profiling

Profile polyadenylated messenger RNA using short-read sequencing to quantify coding transcript expression across eukaryotic samples and conditions.

Quantitative Gene Expression Analysis

Measure gene expression levels across samples to support group comparison, expression pattern analysis and downstream biological interpretation.

Quantitative Gene Expression Analysis

Measure gene expression levels across samples to support group comparison, expression pattern analysis and downstream biological interpretation.

Bioinformatics and NovoMagic Support

Analyse differential expression, enrichment and visual outputs, with selected mRNA-seq results available through NovoMagic for online analysis and review.

Bioinformatics and NovoMagic Support

Analyse differential expression, enrichment and visual outputs, with selected mRNA-seq results available through NovoMagic for online analysis and review.

Scalable Study Support

Support expression profiling across sample groups, time points, treatments and biological conditions, with sequencing depth and analysis options adapted to project needs.

Scalable Study Support

Support expression profiling across sample groups, time points, treatments and biological conditions, with sequencing depth and analysis options adapted to project needs.

Service Highlights

Poly(A)-selected mRNA Profiling

Profile polyadenylated messenger RNA using short-read sequencing to quantify coding transcript expression across eukaryotic samples and conditions.

Poly(A)-selected mRNA Profiling

Profile polyadenylated messenger RNA using short-read sequencing to quantify coding transcript expression across eukaryotic samples and conditions.

Quantitative Gene Expression Analysis

Measure gene expression levels across samples to support group comparison, expression pattern analysis and downstream biological interpretation.

Quantitative Gene Expression Analysis

Measure gene expression levels across samples to support group comparison, expression pattern analysis and downstream biological interpretation.

Bioinformatics and NovoMagic Support

Analyse differential expression, enrichment and visual outputs, with selected mRNA-seq results available through NovoMagic for online analysis and review.

Bioinformatics and NovoMagic Support

Analyse differential expression, enrichment and visual outputs, with selected mRNA-seq results available through NovoMagic for online analysis and review.

Scalable Study Support

Support expression profiling across sample groups, time points, treatments and biological conditions, with sequencing depth and analysis options adapted to project needs.

Scalable Study Support

Support expression profiling across sample groups, time points, treatments and biological conditions, with sequencing depth and analysis options adapted to project needs.

Looking for full-length transcript information?

For isoform-level transcript structure, transcript discovery or detailed splice variant analysis, explore our Full-Length Transcriptome Sequencing service.

Applications

Gene Expression and Biological Response

mRNA-seq helps researchers study how gene activity changes across tissues, cell types, developmental stages, treatments or disease-related conditions.

Gene Expression and Biological Response

mRNA-seq helps researchers study how gene activity changes across tissues, cell types, developmental stages, treatments or disease-related conditions.

Pathway and Mechanism Research

Poly(A)-selected transcriptome data can reveal affected pathways, biological processes and gene networks, helping connect expression changes with biological mechanisms.

Pathway and Mechanism Research

Poly(A)-selected transcriptome data can reveal affected pathways, biological processes and gene networks, helping connect expression changes with biological mechanisms.

Biomarker and Expression Signature Discovery

mRNA-seq supports discovery of expression signatures associated with disease states, treatment response, developmental stages or other biological conditions.

Biomarker and Expression Signature Discovery

mRNA-seq supports discovery of expression signatures associated with disease states, treatment response, developmental stages or other biological conditions.

Cohort and Time-course Profiling

mRNA-seq supports scalable expression profiling across cohorts, time points, treatments and biological conditions, helping researchers compare gene activity across study designs.

Cohort and Time-course Profiling

mRNA-seq supports scalable expression profiling across cohorts, time points, treatments and biological conditions, helping researchers compare gene activity across study designs.

Applications

Gene Expression and Biological Response

mRNA-seq helps researchers study how gene activity changes across tissues, cell types, developmental stages, treatments or disease-related conditions.

Gene Expression and Biological Response

mRNA-seq helps researchers study how gene activity changes across tissues, cell types, developmental stages, treatments or disease-related conditions.

Pathway and Mechanism Research

Poly(A)-selected transcriptome data can reveal affected pathways, biological processes and gene networks, helping connect expression changes with biological mechanisms.

Pathway and Mechanism Research

Poly(A)-selected transcriptome data can reveal affected pathways, biological processes and gene networks, helping connect expression changes with biological mechanisms.

Biomarker and Expression Signature Discovery

mRNA-seq supports discovery of expression signatures associated with disease states, treatment response, developmental stages or other biological conditions.

Biomarker and Expression Signature Discovery

mRNA-seq supports discovery of expression signatures associated with disease states, treatment response, developmental stages or other biological conditions.

Cohort and Time-course Profiling

mRNA-seq supports scalable expression profiling across cohorts, time points, treatments and biological conditions, helping researchers compare gene activity across study designs.

Cohort and Time-course Profiling

mRNA-seq supports scalable expression profiling across cohorts, time points, treatments and biological conditions, helping researchers compare gene activity across study designs.

Specifications

Sample Requirements

The quantities listed are provided for reference only. Please download the Sample Requirements for detailed guidance, or contact us to discuss your project-specific requirements.

ServiceSample TypeAmount (Qubit®)VolumeConcentrationRIN (Agilent 5400)Purity (NanoDrop™)
Eukaryotic mRNA
(polyA enrichment)
Total RNA (animal)≥100 ng≥10 μL≥10 ng/μL≥4.0, with flat baselineOD260/280 = 1.8-2.2;
OD260/230 ≥ 2.0;
no degradation,
no contamination
Total RNA
(plant, fungus)
≥100 ng≥10 μL≥10 ng/μL≥4.0, with flat baseline
Total RNA (blood)≥400 ng≥20 μL≥20 ng/μL≥5.0, with flat baseline
Strand-specific Eukaryotic mRNA
(polyA enrichment)
Total RNA (animal)≥200 ng≥10 μL≥20 ng/μL≥5.0, with flat baseline
Total RNA (plant, fungus)≥200 ng≥10 μL≥20 ng/μL≥5.0, with flat baseline
Total RNA (blood)≥400 ng≥20 μL≥20 ng/μL≥5.0, with flat baseline

Sample Requirements

The quantities listed are provided for reference only. Please download the Sample Requirements for detailed guidance, or contact us to discuss your project-specific requirements.

ServiceSample TypeAmount (Qubit®)VolumeConcentrationRIN (Agilent 5400)Purity (NanoDrop™)
Eukaryotic mRNA
(polyA enrichment)
Total RNA (animal)≥100 ng≥10 μL≥10 ng/μL≥4.0, with flat baselineOD260/280 = 1.8-2.2;
OD260/230 ≥ 2.0;
no degradation,
no contamination
Total RNA
(plant, fungus)
≥100 ng≥10 μL≥10 ng/μL≥4.0, with flat baseline
Total RNA (blood)≥400 ng≥20 μL≥20 ng/μL≥5.0, with flat baseline
Strand-specific Eukaryotic mRNA
(polyA enrichment)
Total RNA (animal)≥200 ng≥10 μL≥20 ng/μL≥5.0, with flat baseline
Total RNA (plant, fungus)≥200 ng≥10 μL≥20 ng/μL≥5.0, with flat baseline
Total RNA (blood)≥400 ng≥20 μL≥20 ng/μL≥5.0, with flat baseline

Sample Requirements

The quantities listed are provided for reference only. Please download the Sample Requirements for detailed guidance, or contact us to discuss your project-specific requirements.

ServiceSample TypeAmount (Qubit®)VolumeConcentrationRIN (Agilent 5400)Purity (NanoDrop™)
Eukaryotic mRNA
(polyA enrichment)
Total RNA (animal)≥100 ng≥10 μL≥10 ng/μL≥4.0, with flat baselineOD260/280 = 1.8-2.2;
OD260/230 ≥ 2.0;
no degradation,
no contamination
Total RNA
(plant, fungus)
≥100 ng≥10 μL≥10 ng/μL≥4.0, with flat baseline
Total RNA (blood)≥400 ng≥20 μL≥20 ng/μL≥5.0, with flat baseline
Strand-specific Eukaryotic mRNA
(polyA enrichment)
Total RNA (animal)≥200 ng≥10 μL≥20 ng/μL≥5.0, with flat baseline
Total RNA (plant, fungus)≥200 ng≥10 μL≥20 ng/μL≥5.0, with flat baseline
Total RNA (blood)≥400 ng≥20 μL≥20 ng/μL≥5.0, with flat baseline

Sample Requirements

The quantities listed are provided for reference only. Please download the Sample Requirements for detailed guidance, or contact us to discuss your project-specific requirements.

ServiceSample TypeAmount (Qubit®)VolumeConcentrationRIN (Agilent 5400)Purity (NanoDrop™)
Eukaryotic mRNA
(polyA enrichment)
Total RNA (animal)≥100 ng≥10 μL≥10 ng/μL≥4.0, with flat baselineOD260/280 = 1.8-2.2;
OD260/230 ≥ 2.0;
no degradation,
no contamination
Total RNA
(plant, fungus)
≥100 ng≥10 μL≥10 ng/μL≥4.0, with flat baseline
Total RNA (blood)≥400 ng≥20 μL≥20 ng/μL≥5.0, with flat baseline
Strand-specific Eukaryotic mRNA
(polyA enrichment)
Total RNA (animal)≥200 ng≥10 μL≥20 ng/μL≥5.0, with flat baseline
Total RNA (plant, fungus)≥200 ng≥10 μL≥20 ng/μL≥5.0, with flat baseline
Total RNA (blood)≥400 ng≥20 μL≥20 ng/μL≥5.0, with flat baseline

Sequencing and Analysis

Recommended data outputs and analysis contents displayed are for reference only. For detailed information, please contact us with your customized requests.

Sequencing PlatformIllumina NovaSeq X-Plus Sequencing Platform
Read LengthPaired-end 150 bp
Recommended Data Output≥ 20 million read pairs per sample for species with reference genome≥ 50 million read pairs per sample for species without reference genome (de novo transcriptome assembly projects)
Data Analysis CapabilityData quality control
Gene expression quantification
Differential expression profiling
SNP & InDel analysis
Alternative splicing analysis
Functional enrichment analysis like GO, KEGG, Protein-protein interaction (PPI) analysis, etc.
Note: Recommended data outputs and analysis contents displayed are for reference only. Download the Service Specifications to learn more. For detailed information, please contact us with your customized requests.

Sequencing and Analysis

Recommended data outputs and analysis contents displayed are for reference only. For detailed information, please contact us with your customized requests.

Sequencing PlatformIllumina NovaSeq X-Plus Sequencing Platform
Read LengthPaired-end 150 bp
Recommended Data Output≥ 20 million read pairs per sample for species with reference genome≥ 50 million read pairs per sample for species without reference genome (de novo transcriptome assembly projects)
Data Analysis CapabilityData quality control
Gene expression quantification
Differential expression profiling
SNP & InDel analysis
Alternative splicing analysis
Functional enrichment analysis like GO, KEGG, Protein-protein interaction (PPI) analysis, etc.
Note: Recommended data outputs and analysis contents displayed are for reference only. Download the Service Specifications to learn more. For detailed information, please contact us with your customized requests.

Sequencing and Analysis

Recommended data outputs and analysis contents displayed are for reference only. For detailed information, please contact us with your customized requests.

Sequencing PlatformIllumina NovaSeq X-Plus Sequencing Platform
Read LengthPaired-end 150 bp
Recommended Data Output≥ 20 million read pairs per sample for species with reference genome≥ 50 million read pairs per sample for species without reference genome (de novo transcriptome assembly projects)
Data Analysis CapabilityData quality control
Gene expression quantification
Differential expression profiling
SNP & InDel analysis
Alternative splicing analysis
Functional enrichment analysis like GO, KEGG, Protein-protein interaction (PPI) analysis, etc.
Note: Recommended data outputs and analysis contents displayed are for reference only. Download the Service Specifications to learn more. For detailed information, please contact us with your customized requests.

Sequencing and Analysis

Recommended data outputs and analysis contents displayed are for reference only. For detailed information, please contact us with your customized requests.

Sequencing PlatformIllumina NovaSeq X-Plus Sequencing Platform
Read LengthPaired-end 150 bp
Recommended Data Output≥ 20 million read pairs per sample for species with reference genome≥ 50 million read pairs per sample for species without reference genome (de novo transcriptome assembly projects)
Data Analysis CapabilityData quality control
Gene expression quantification
Differential expression profiling
SNP & InDel analysis
Alternative splicing analysis
Functional enrichment analysis like GO, KEGG, Protein-protein interaction (PPI) analysis, etc.
Note: Recommended data outputs and analysis contents displayed are for reference only. Download the Service Specifications to learn more. For detailed information, please contact us with your customized requests.

Specifications

Sample Requirements

The quantities listed are provided for reference only. Please download the Sample Requirements for detailed guidance, or contact us to discuss your project-specific requirements.

ServiceSample TypeAmount (Qubit®)VolumeConcentrationRIN (Agilent 5400)Purity (NanoDrop™)
Eukaryotic mRNA
(polyA enrichment)
Total RNA (animal)≥100 ng≥10 μL≥10 ng/μL≥4.0, with flat baselineOD260/280 = 1.8-2.2;
OD260/230 ≥ 2.0;
no degradation,
no contamination
Total RNA
(plant, fungus)
≥100 ng≥10 μL≥10 ng/μL≥4.0, with flat baseline
Total RNA (blood)≥400 ng≥20 μL≥20 ng/μL≥5.0, with flat baseline
Strand-specific Eukaryotic mRNA
(polyA enrichment)
Total RNA (animal)≥200 ng≥10 μL≥20 ng/μL≥5.0, with flat baseline
Total RNA (plant, fungus)≥200 ng≥10 μL≥20 ng/μL≥5.0, with flat baseline
Total RNA (blood)≥400 ng≥20 μL≥20 ng/μL≥5.0, with flat baseline

Sample Requirements

The quantities listed are provided for reference only. Please download the Sample Requirements for detailed guidance, or contact us to discuss your project-specific requirements.

ServiceSample TypeAmount (Qubit®)VolumeConcentrationRIN (Agilent 5400)Purity (NanoDrop™)
Eukaryotic mRNA
(polyA enrichment)
Total RNA (animal)≥100 ng≥10 μL≥10 ng/μL≥4.0, with flat baselineOD260/280 = 1.8-2.2;
OD260/230 ≥ 2.0;
no degradation,
no contamination
Total RNA
(plant, fungus)
≥100 ng≥10 μL≥10 ng/μL≥4.0, with flat baseline
Total RNA (blood)≥400 ng≥20 μL≥20 ng/μL≥5.0, with flat baseline
Strand-specific Eukaryotic mRNA
(polyA enrichment)
Total RNA (animal)≥200 ng≥10 μL≥20 ng/μL≥5.0, with flat baseline
Total RNA (plant, fungus)≥200 ng≥10 μL≥20 ng/μL≥5.0, with flat baseline
Total RNA (blood)≥400 ng≥20 μL≥20 ng/μL≥5.0, with flat baseline

Sample Requirements

The quantities listed are provided for reference only. Please download the Sample Requirements for detailed guidance, or contact us to discuss your project-specific requirements.

ServiceSample TypeAmount (Qubit®)VolumeConcentrationRIN (Agilent 5400)Purity (NanoDrop™)
Eukaryotic mRNA
(polyA enrichment)
Total RNA (animal)≥100 ng≥10 μL≥10 ng/μL≥4.0, with flat baselineOD260/280 = 1.8-2.2;
OD260/230 ≥ 2.0;
no degradation,
no contamination
Total RNA
(plant, fungus)
≥100 ng≥10 μL≥10 ng/μL≥4.0, with flat baseline
Total RNA (blood)≥400 ng≥20 μL≥20 ng/μL≥5.0, with flat baseline
Strand-specific Eukaryotic mRNA
(polyA enrichment)
Total RNA (animal)≥200 ng≥10 μL≥20 ng/μL≥5.0, with flat baseline
Total RNA (plant, fungus)≥200 ng≥10 μL≥20 ng/μL≥5.0, with flat baseline
Total RNA (blood)≥400 ng≥20 μL≥20 ng/μL≥5.0, with flat baseline

Sample Requirements

The quantities listed are provided for reference only. Please download the Sample Requirements for detailed guidance, or contact us to discuss your project-specific requirements.

ServiceSample TypeAmount (Qubit®)VolumeConcentrationRIN (Agilent 5400)Purity (NanoDrop™)
Eukaryotic mRNA
(polyA enrichment)
Total RNA (animal)≥100 ng≥10 μL≥10 ng/μL≥4.0, with flat baselineOD260/280 = 1.8-2.2;
OD260/230 ≥ 2.0;
no degradation,
no contamination
Total RNA
(plant, fungus)
≥100 ng≥10 μL≥10 ng/μL≥4.0, with flat baseline
Total RNA (blood)≥400 ng≥20 μL≥20 ng/μL≥5.0, with flat baseline
Strand-specific Eukaryotic mRNA
(polyA enrichment)
Total RNA (animal)≥200 ng≥10 μL≥20 ng/μL≥5.0, with flat baseline
Total RNA (plant, fungus)≥200 ng≥10 μL≥20 ng/μL≥5.0, with flat baseline
Total RNA (blood)≥400 ng≥20 μL≥20 ng/μL≥5.0, with flat baseline

Sequencing and Analysis

Recommended data outputs and analysis contents displayed are for reference only. For detailed information, please contact us with your customized requests.

Sequencing PlatformIllumina NovaSeq X-Plus Sequencing Platform
Read LengthPaired-end 150 bp
Recommended Data Output≥ 20 million read pairs per sample for species with reference genome≥ 50 million read pairs per sample for species without reference genome (de novo transcriptome assembly projects)
Data Analysis CapabilityData quality control
Gene expression quantification
Differential expression profiling
SNP & InDel analysis
Alternative splicing analysis
Functional enrichment analysis like GO, KEGG, Protein-protein interaction (PPI) analysis, etc.
Note: Recommended data outputs and analysis contents displayed are for reference only. Download the Service Specifications to learn more. For detailed information, please contact us with your customized requests.

Sequencing and Analysis

Recommended data outputs and analysis contents displayed are for reference only. For detailed information, please contact us with your customized requests.

Sequencing PlatformIllumina NovaSeq X-Plus Sequencing Platform
Read LengthPaired-end 150 bp
Recommended Data Output≥ 20 million read pairs per sample for species with reference genome≥ 50 million read pairs per sample for species without reference genome (de novo transcriptome assembly projects)
Data Analysis CapabilityData quality control
Gene expression quantification
Differential expression profiling
SNP & InDel analysis
Alternative splicing analysis
Functional enrichment analysis like GO, KEGG, Protein-protein interaction (PPI) analysis, etc.
Note: Recommended data outputs and analysis contents displayed are for reference only. Download the Service Specifications to learn more. For detailed information, please contact us with your customized requests.

Sequencing and Analysis

Recommended data outputs and analysis contents displayed are for reference only. For detailed information, please contact us with your customized requests.

Sequencing PlatformIllumina NovaSeq X-Plus Sequencing Platform
Read LengthPaired-end 150 bp
Recommended Data Output≥ 20 million read pairs per sample for species with reference genome≥ 50 million read pairs per sample for species without reference genome (de novo transcriptome assembly projects)
Data Analysis CapabilityData quality control
Gene expression quantification
Differential expression profiling
SNP & InDel analysis
Alternative splicing analysis
Functional enrichment analysis like GO, KEGG, Protein-protein interaction (PPI) analysis, etc.
Note: Recommended data outputs and analysis contents displayed are for reference only. Download the Service Specifications to learn more. For detailed information, please contact us with your customized requests.

Sequencing and Analysis

Recommended data outputs and analysis contents displayed are for reference only. For detailed information, please contact us with your customized requests.

Sequencing PlatformIllumina NovaSeq X-Plus Sequencing Platform
Read LengthPaired-end 150 bp
Recommended Data Output≥ 20 million read pairs per sample for species with reference genome≥ 50 million read pairs per sample for species without reference genome (de novo transcriptome assembly projects)
Data Analysis CapabilityData quality control
Gene expression quantification
Differential expression profiling
SNP & InDel analysis
Alternative splicing analysis
Functional enrichment analysis like GO, KEGG, Protein-protein interaction (PPI) analysis, etc.
Note: Recommended data outputs and analysis contents displayed are for reference only. Download the Service Specifications to learn more. For detailed information, please contact us with your customized requests.

Resources

Example Analysis Output

Image
Image
1/1
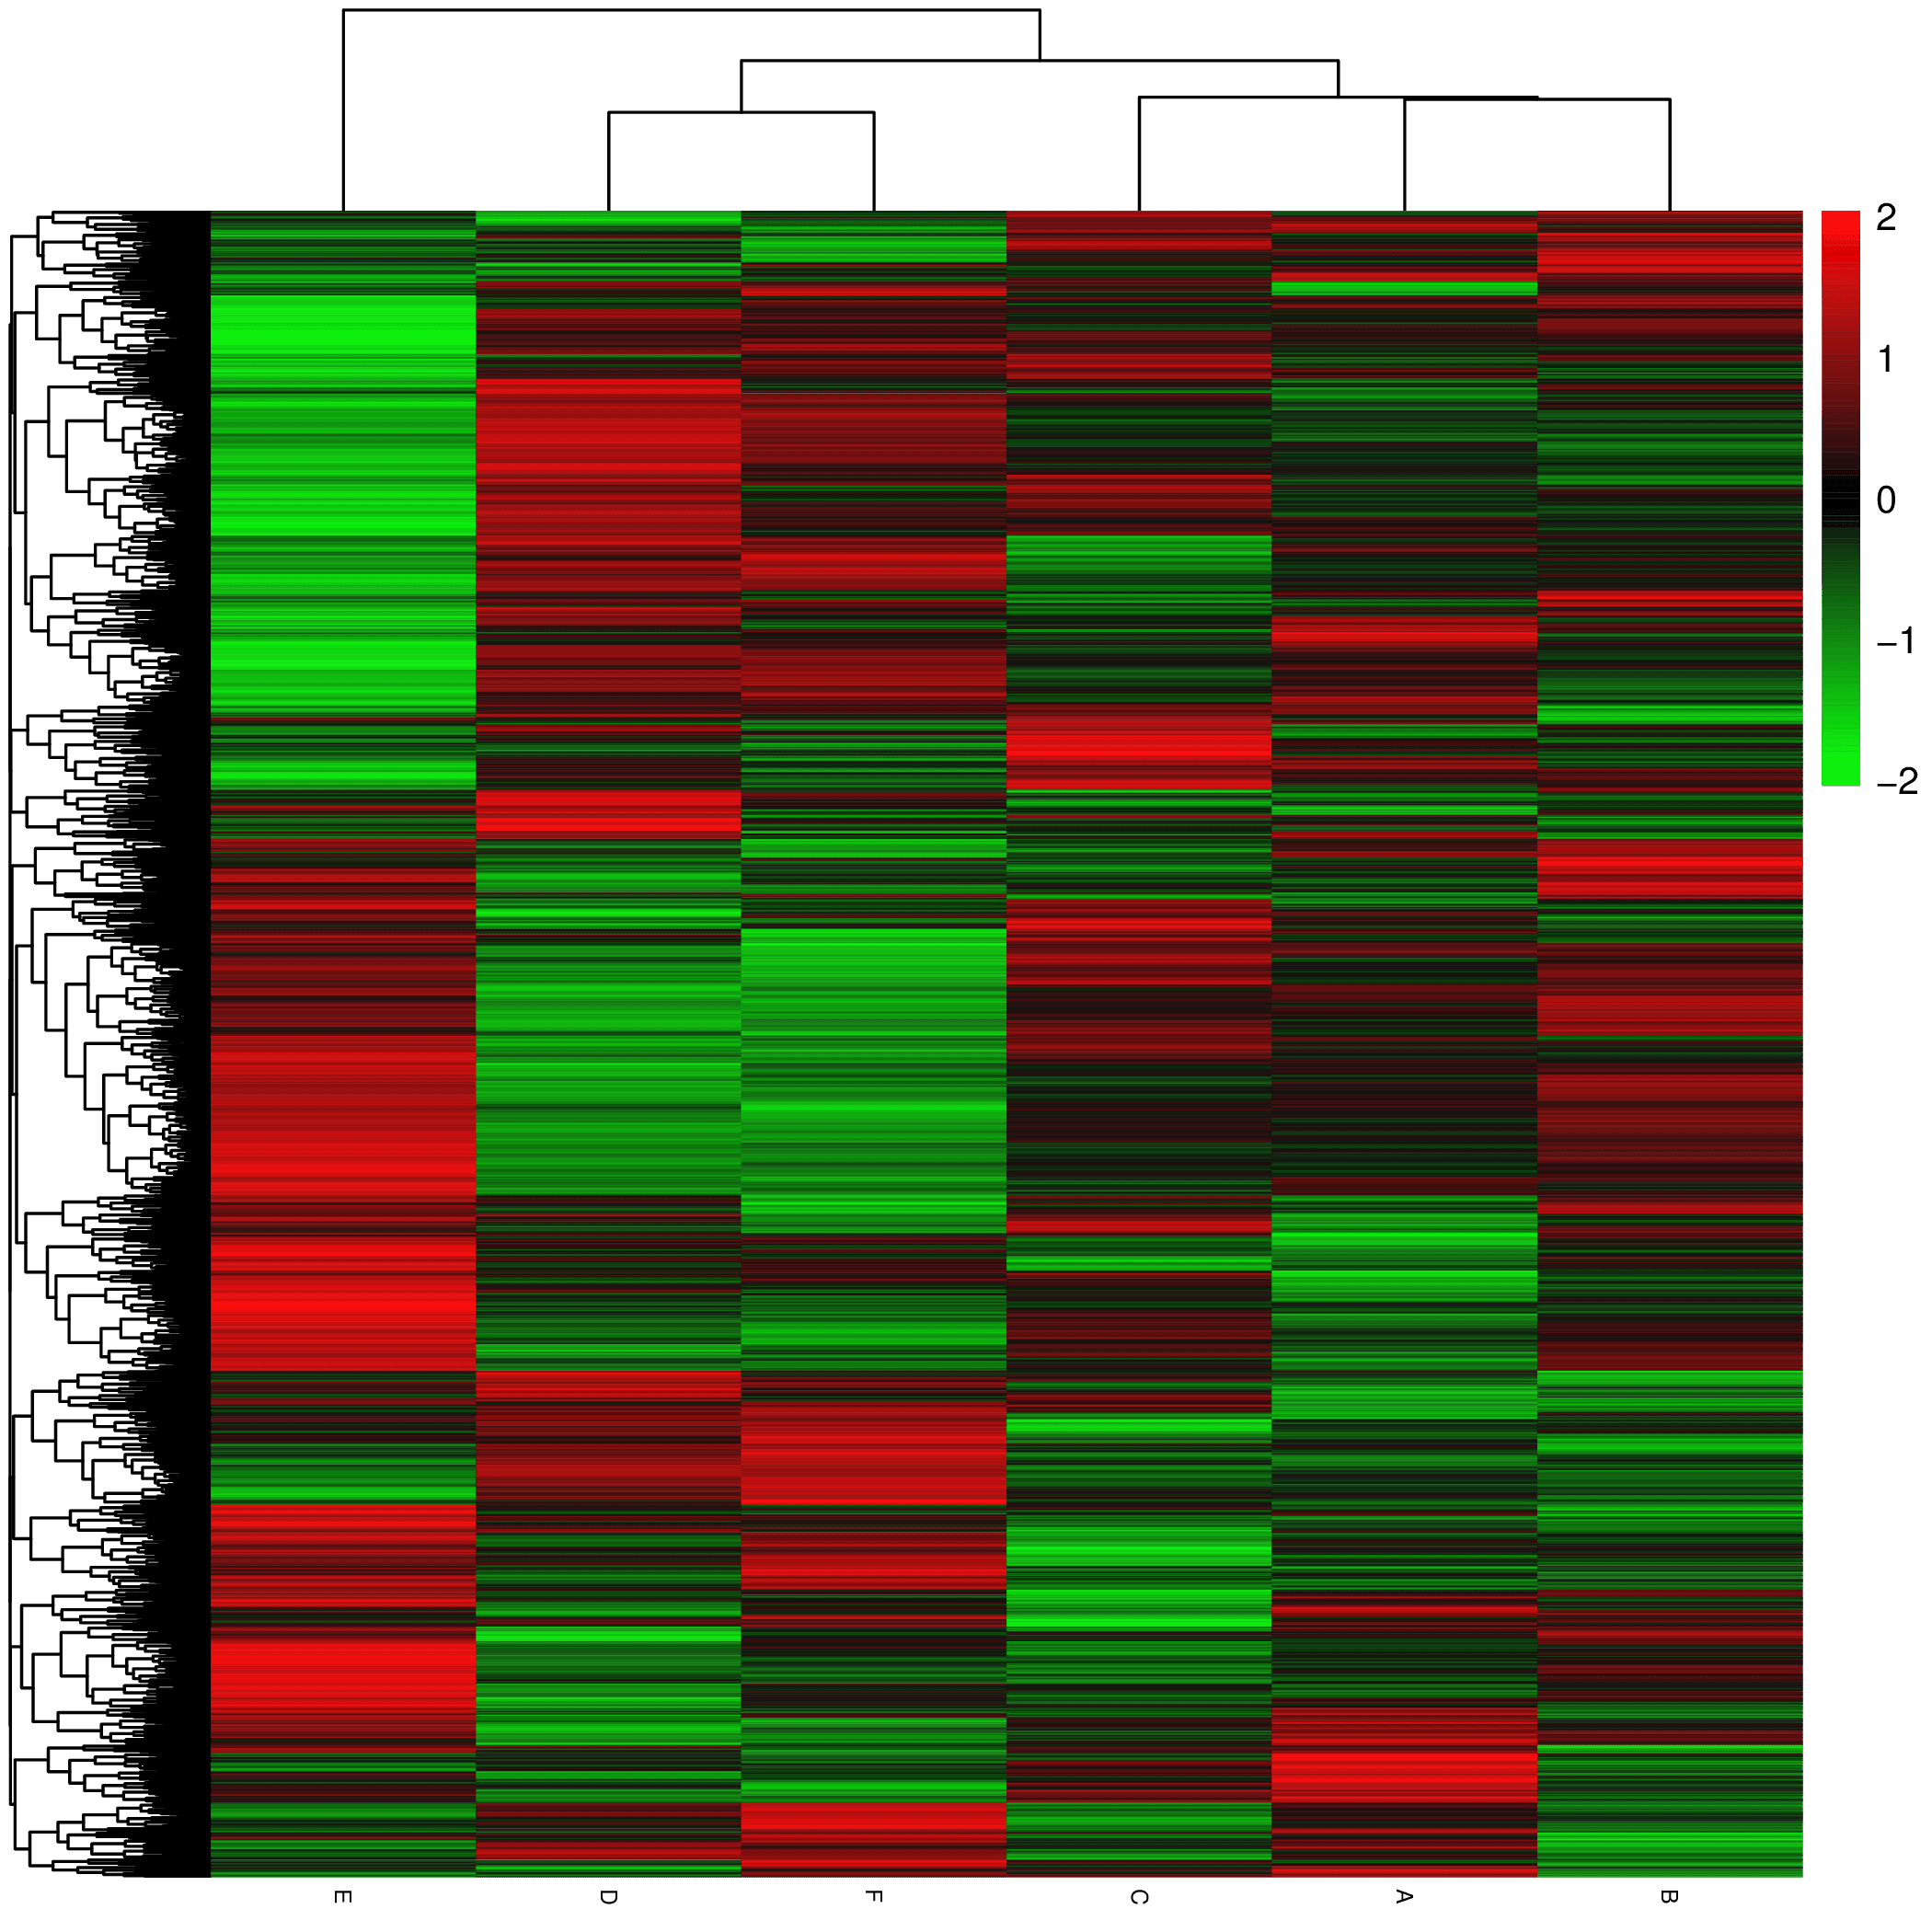
Differential Gene Heatmap

Visualise expression patterns of differentially expressed genes across samples and experimental groups.

Image
Image
1/1
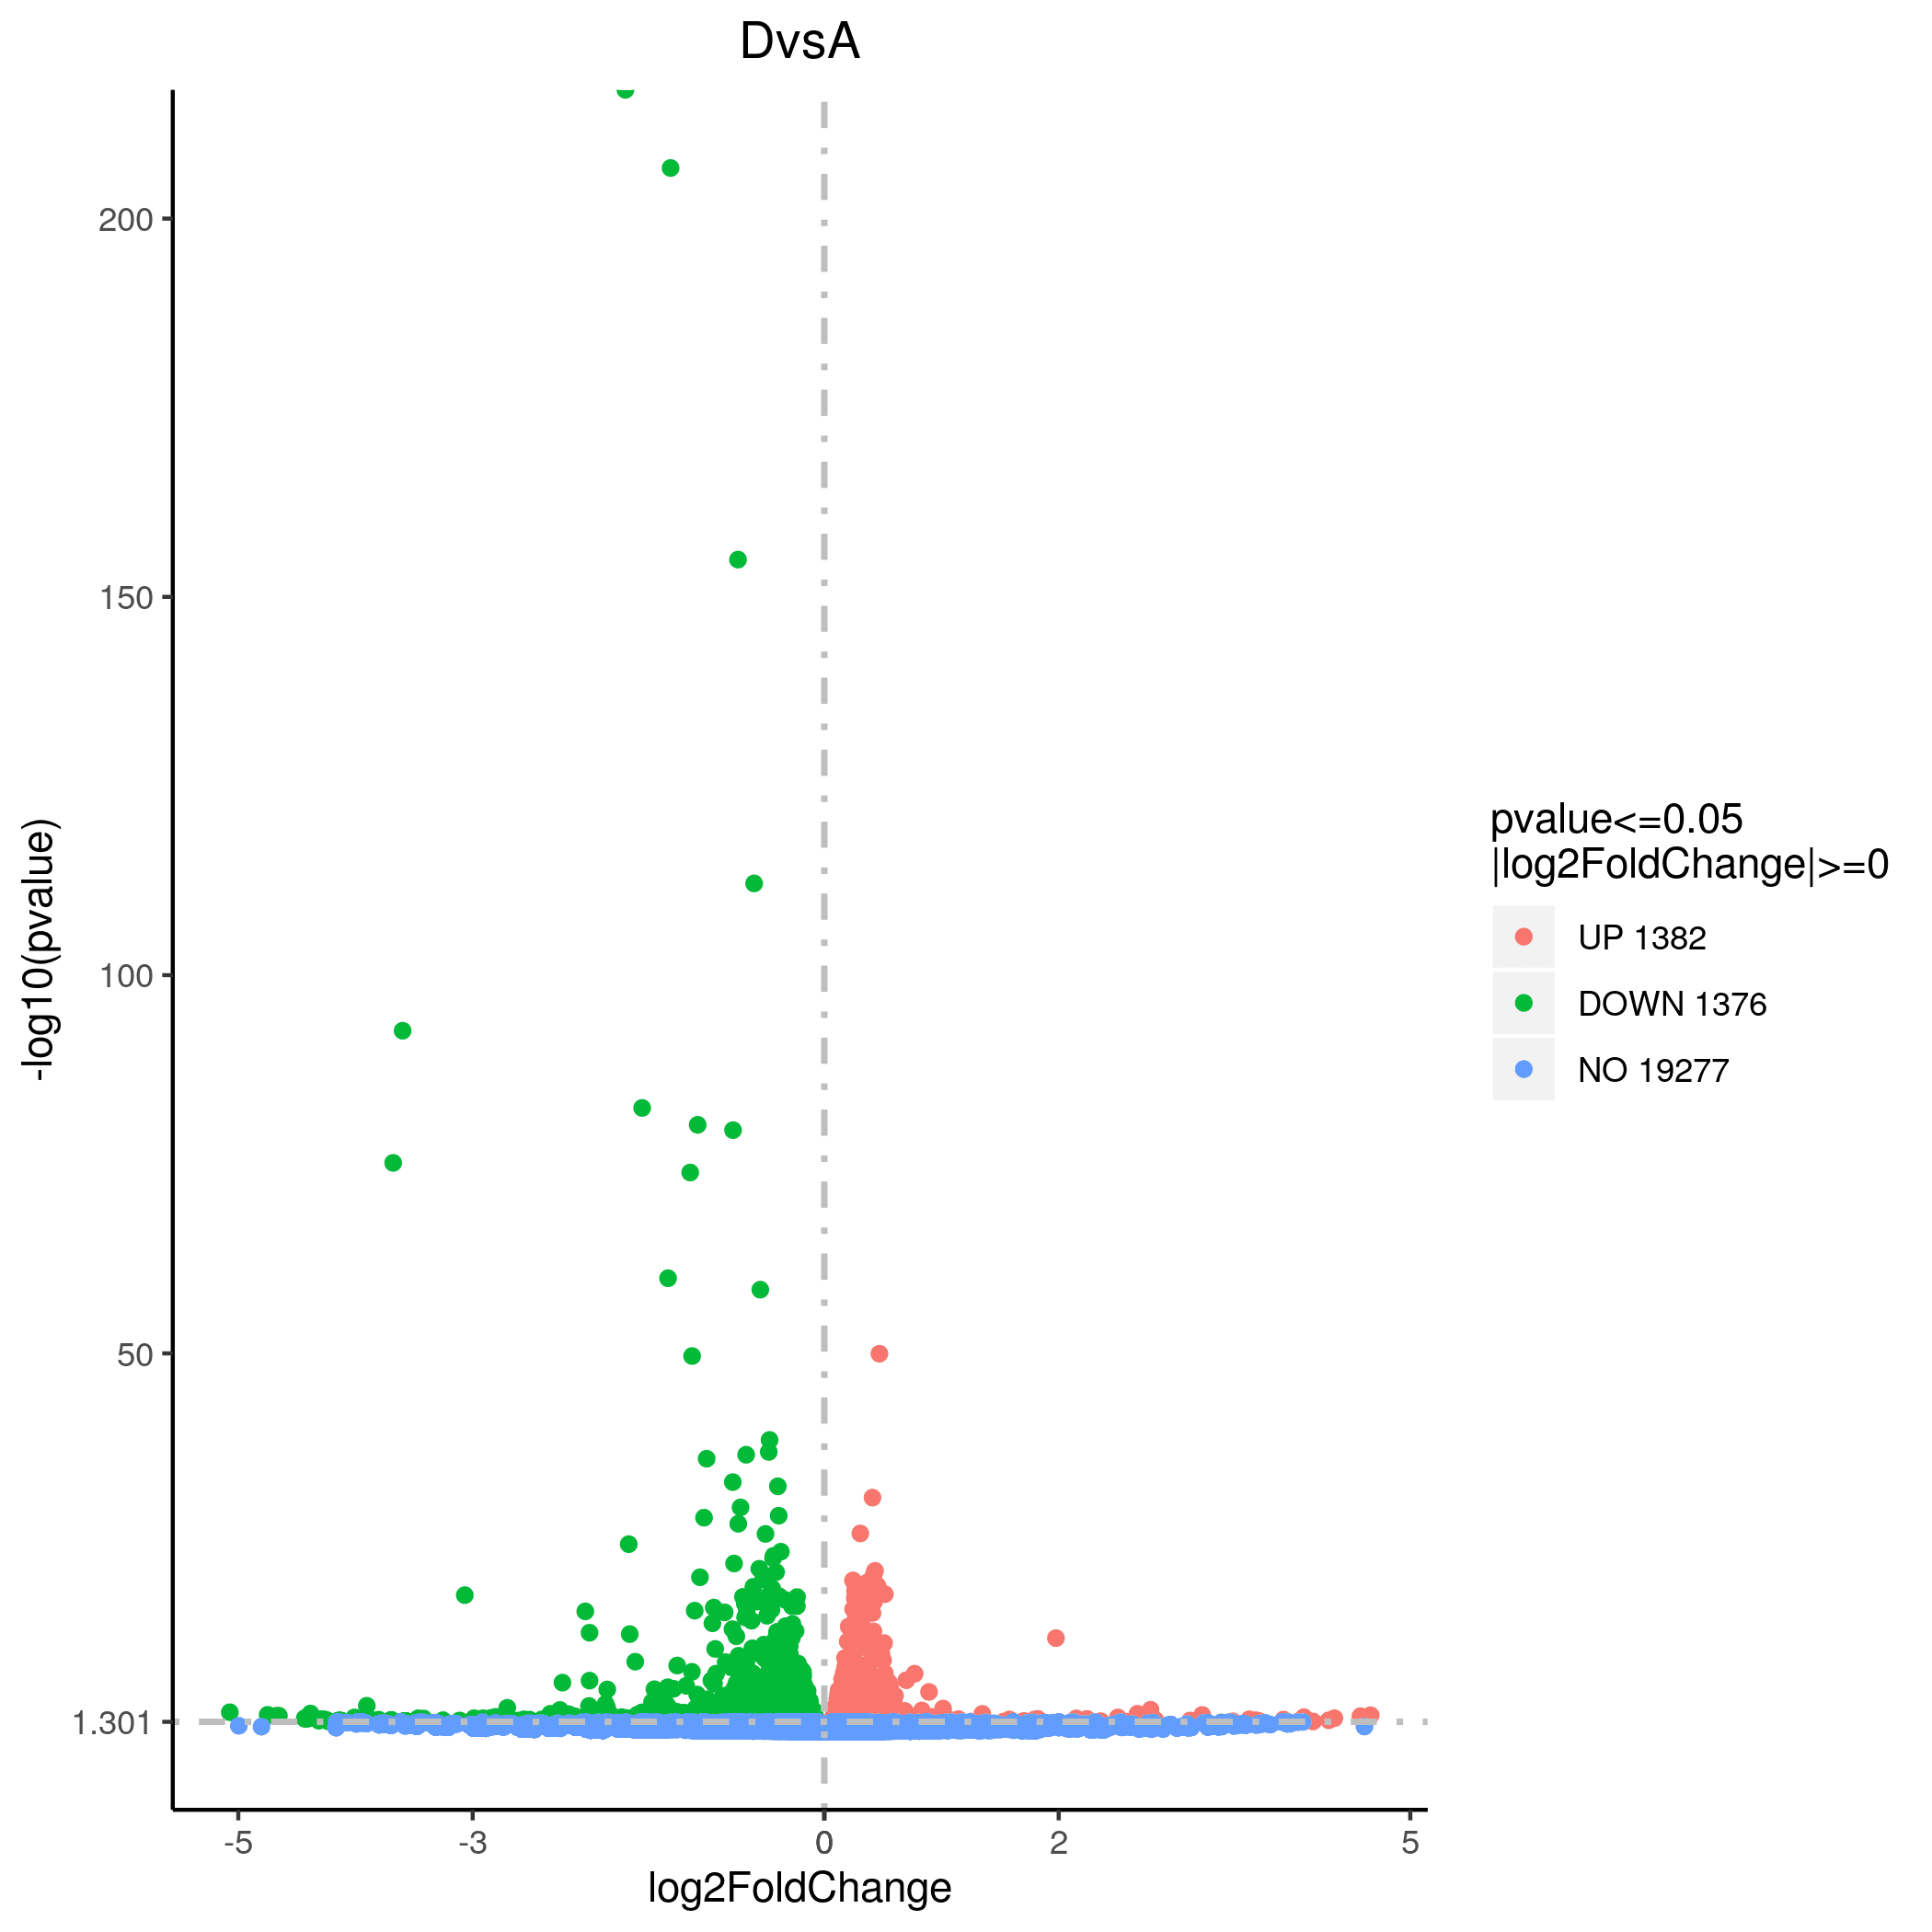
Expression Volcano Plot

Highlight significantly up- and down-regulated genes based on fold change and statistical significance.

Image
Image
1/1
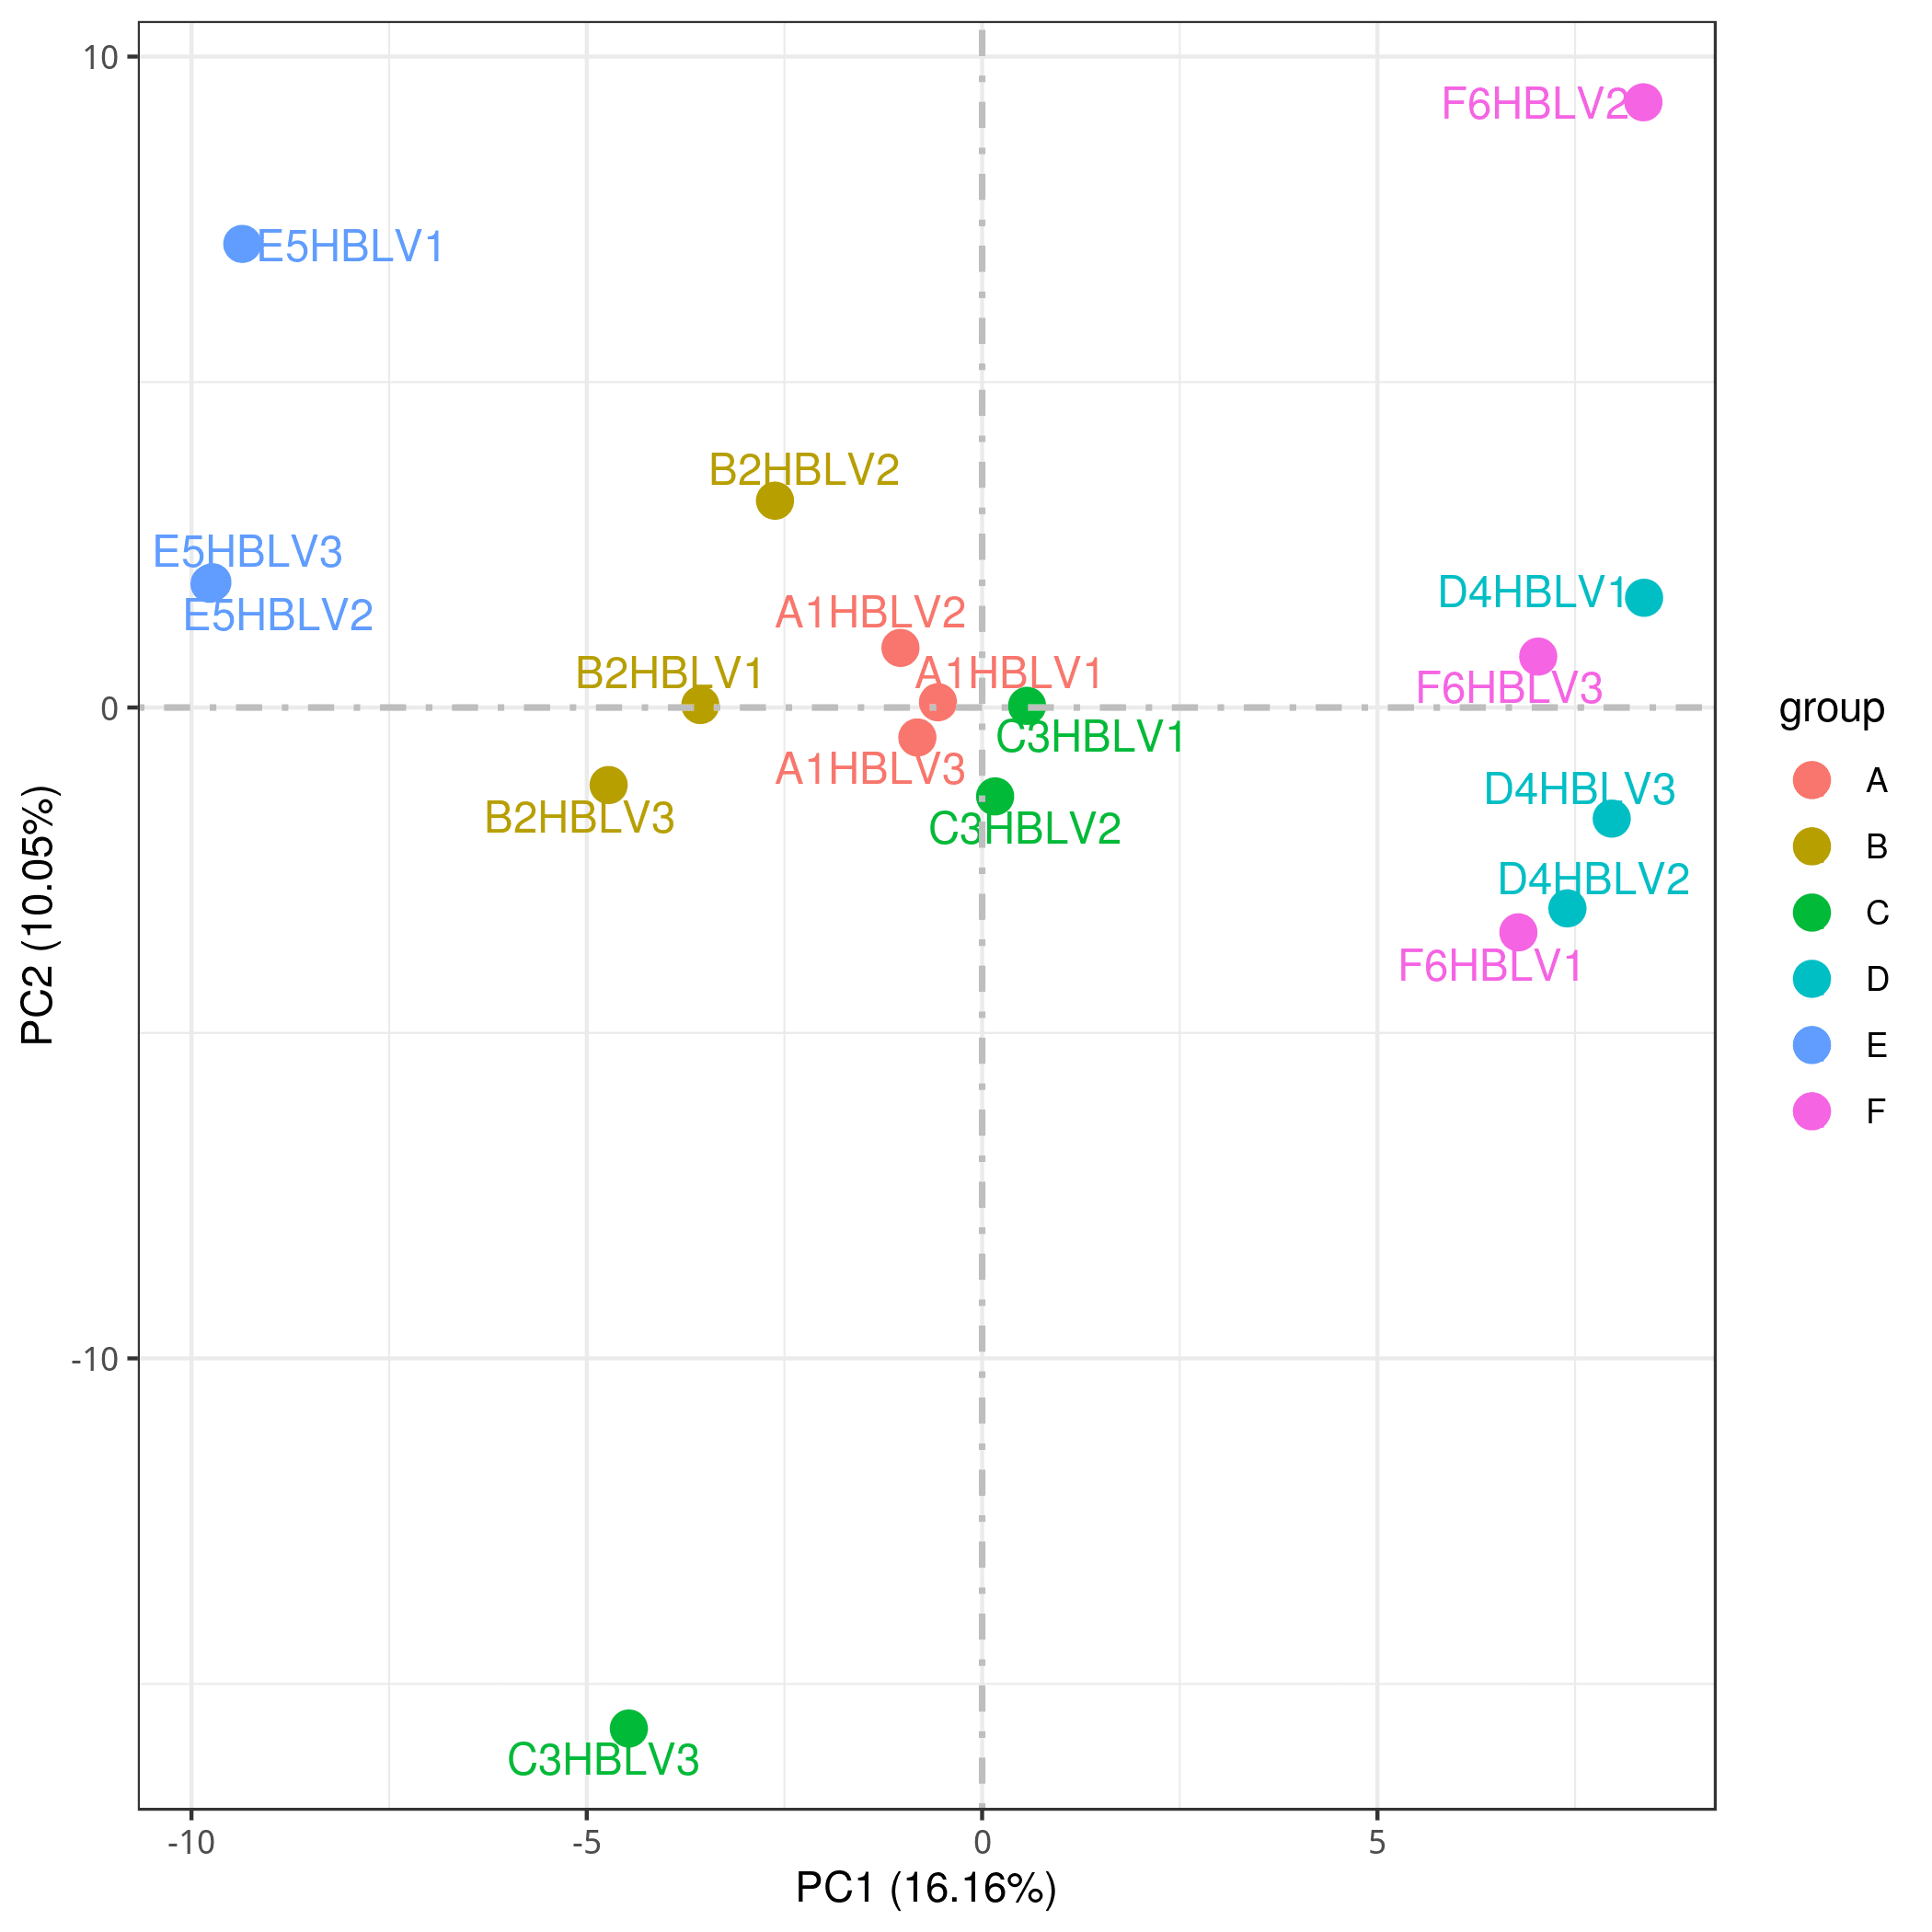
Sample PCA

Assess overall expression profile variation and sample grouping across experimental conditions

Image
Image
1/1
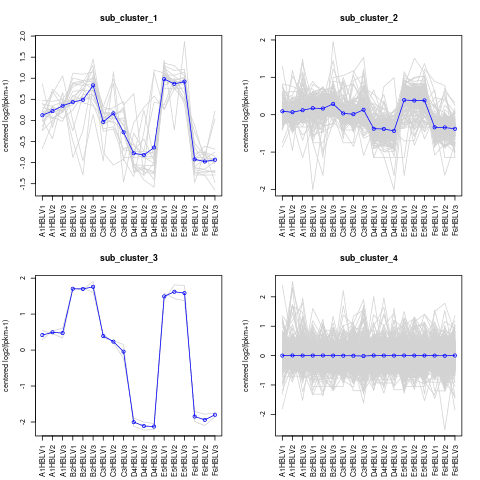
Expression Pattern Clustering

Group genes with similar expression patterns to explore shared regulatory trends across samples.

Image
Image
1/1
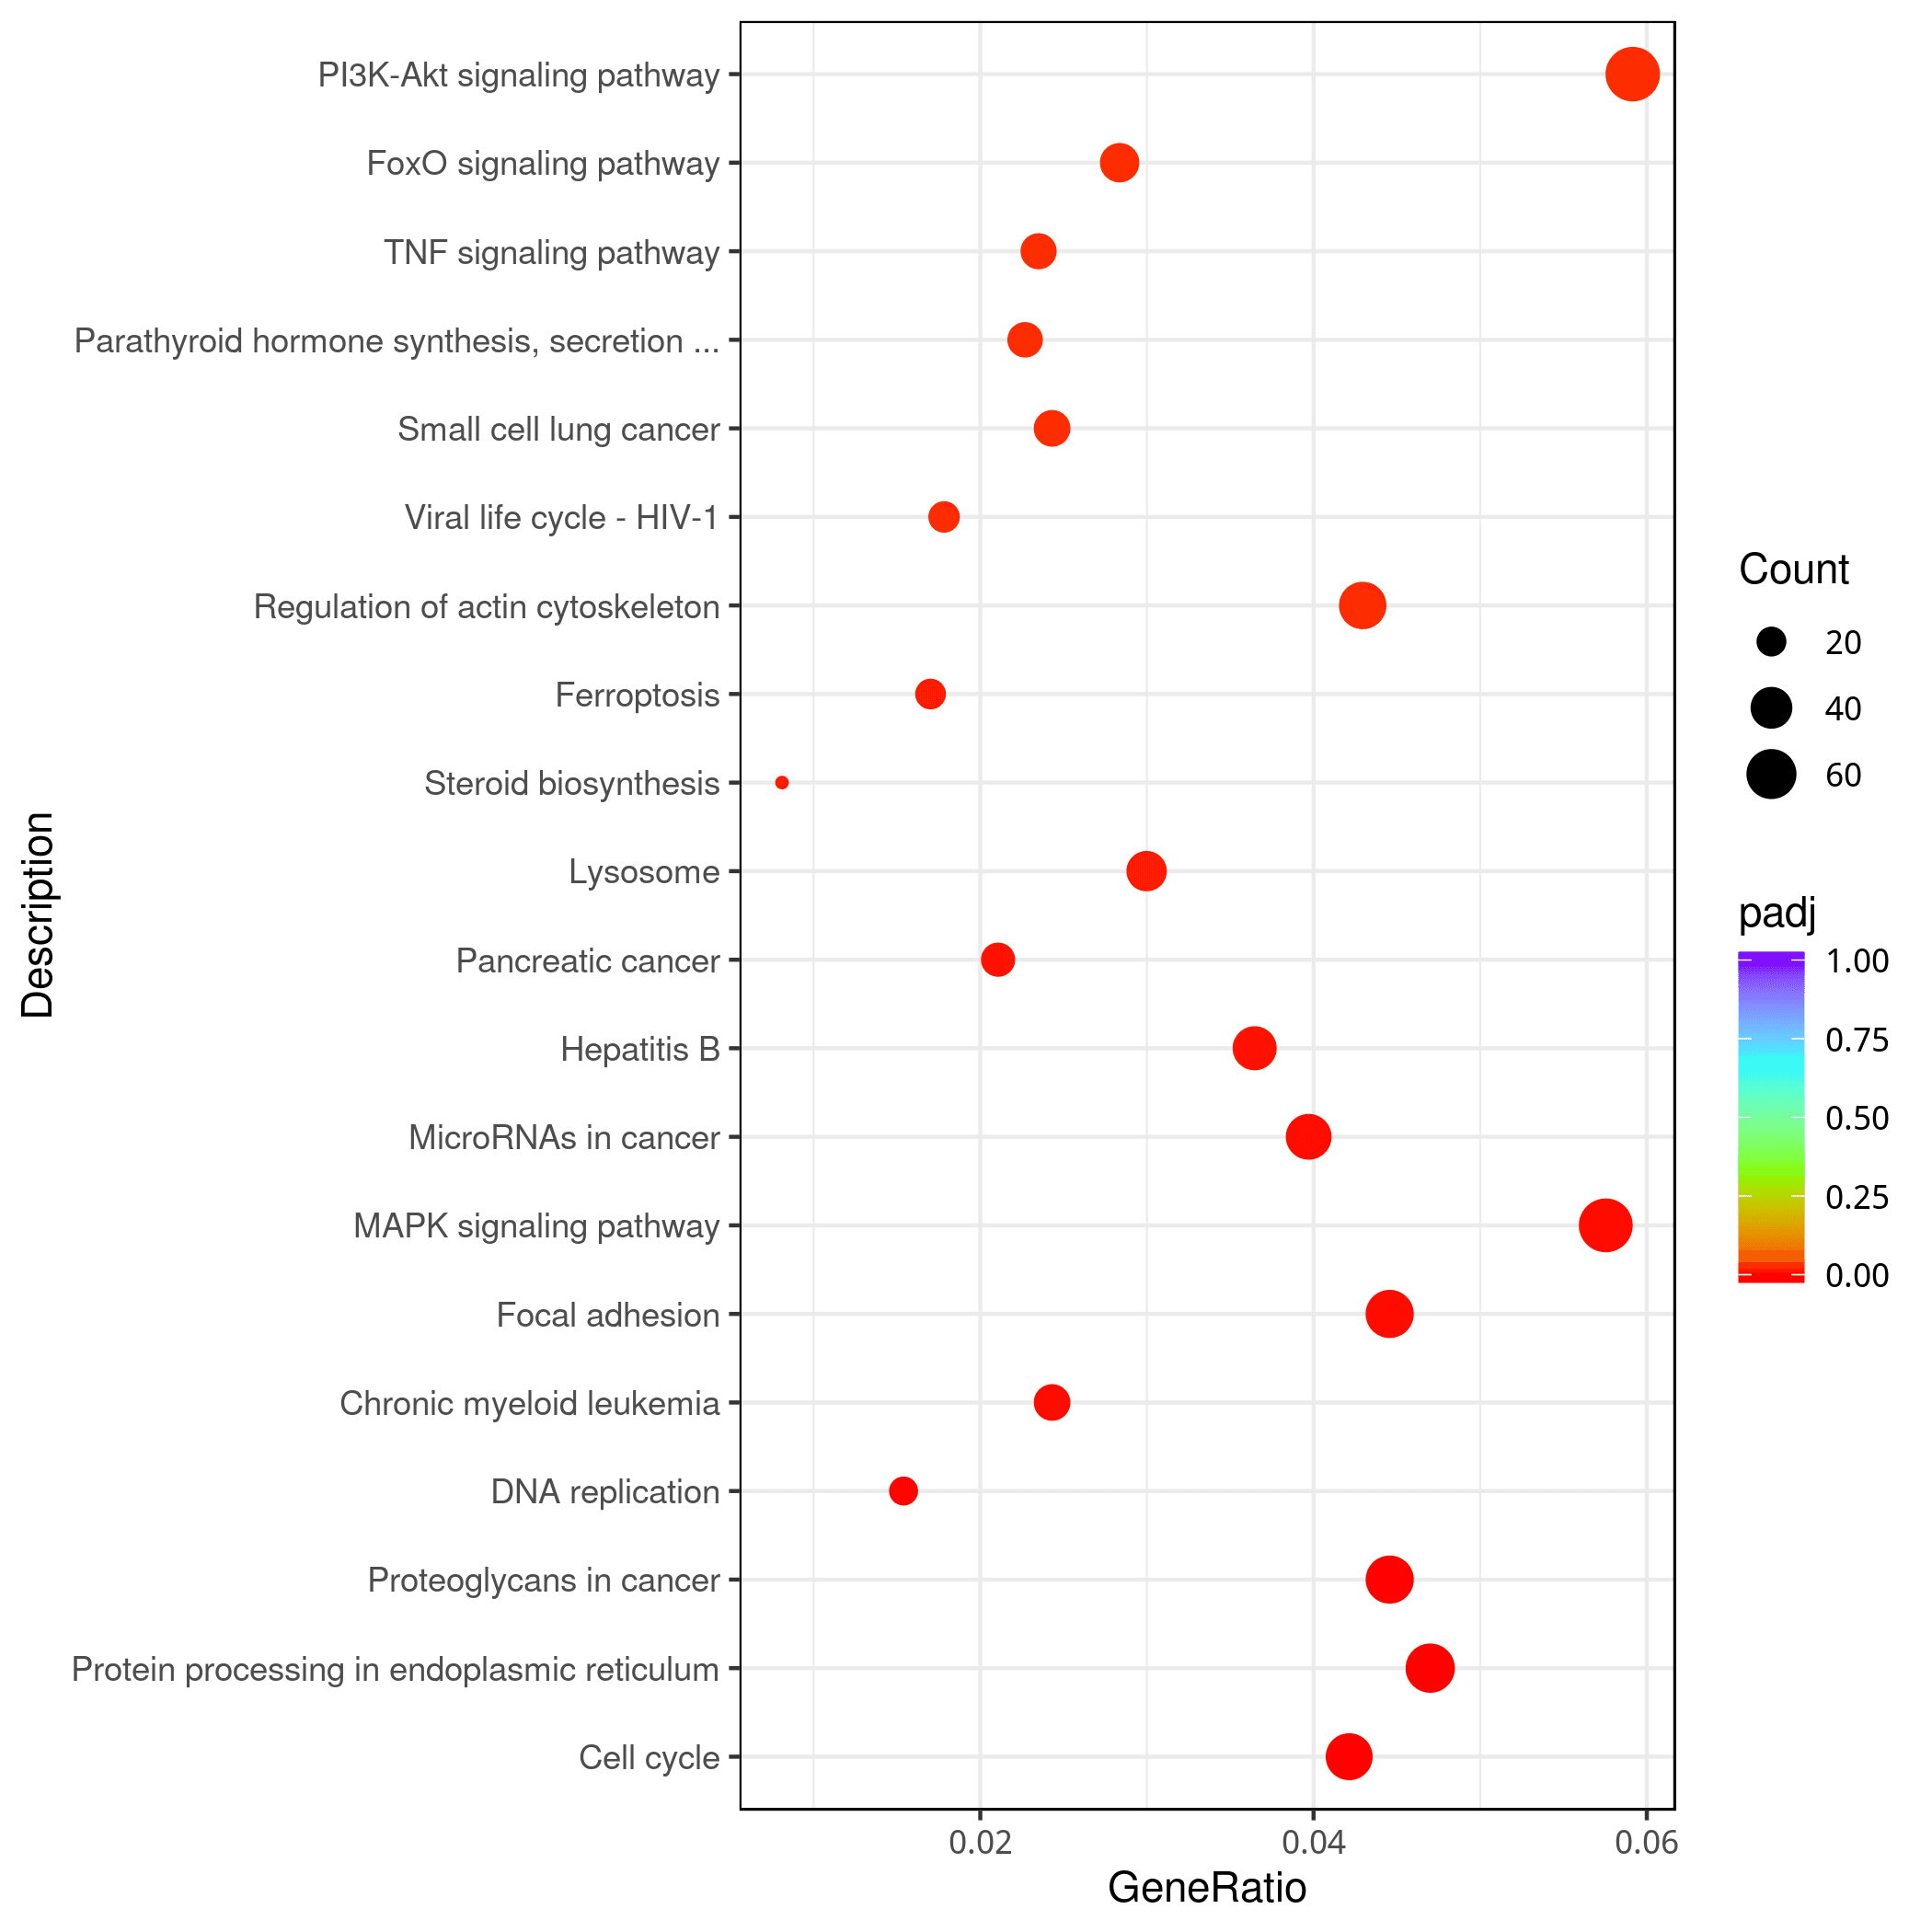
KEGG Enrichment Analysis

Identify enriched pathways associated with differentially expressed genes for functional interpretation.

Image
Image
1/1
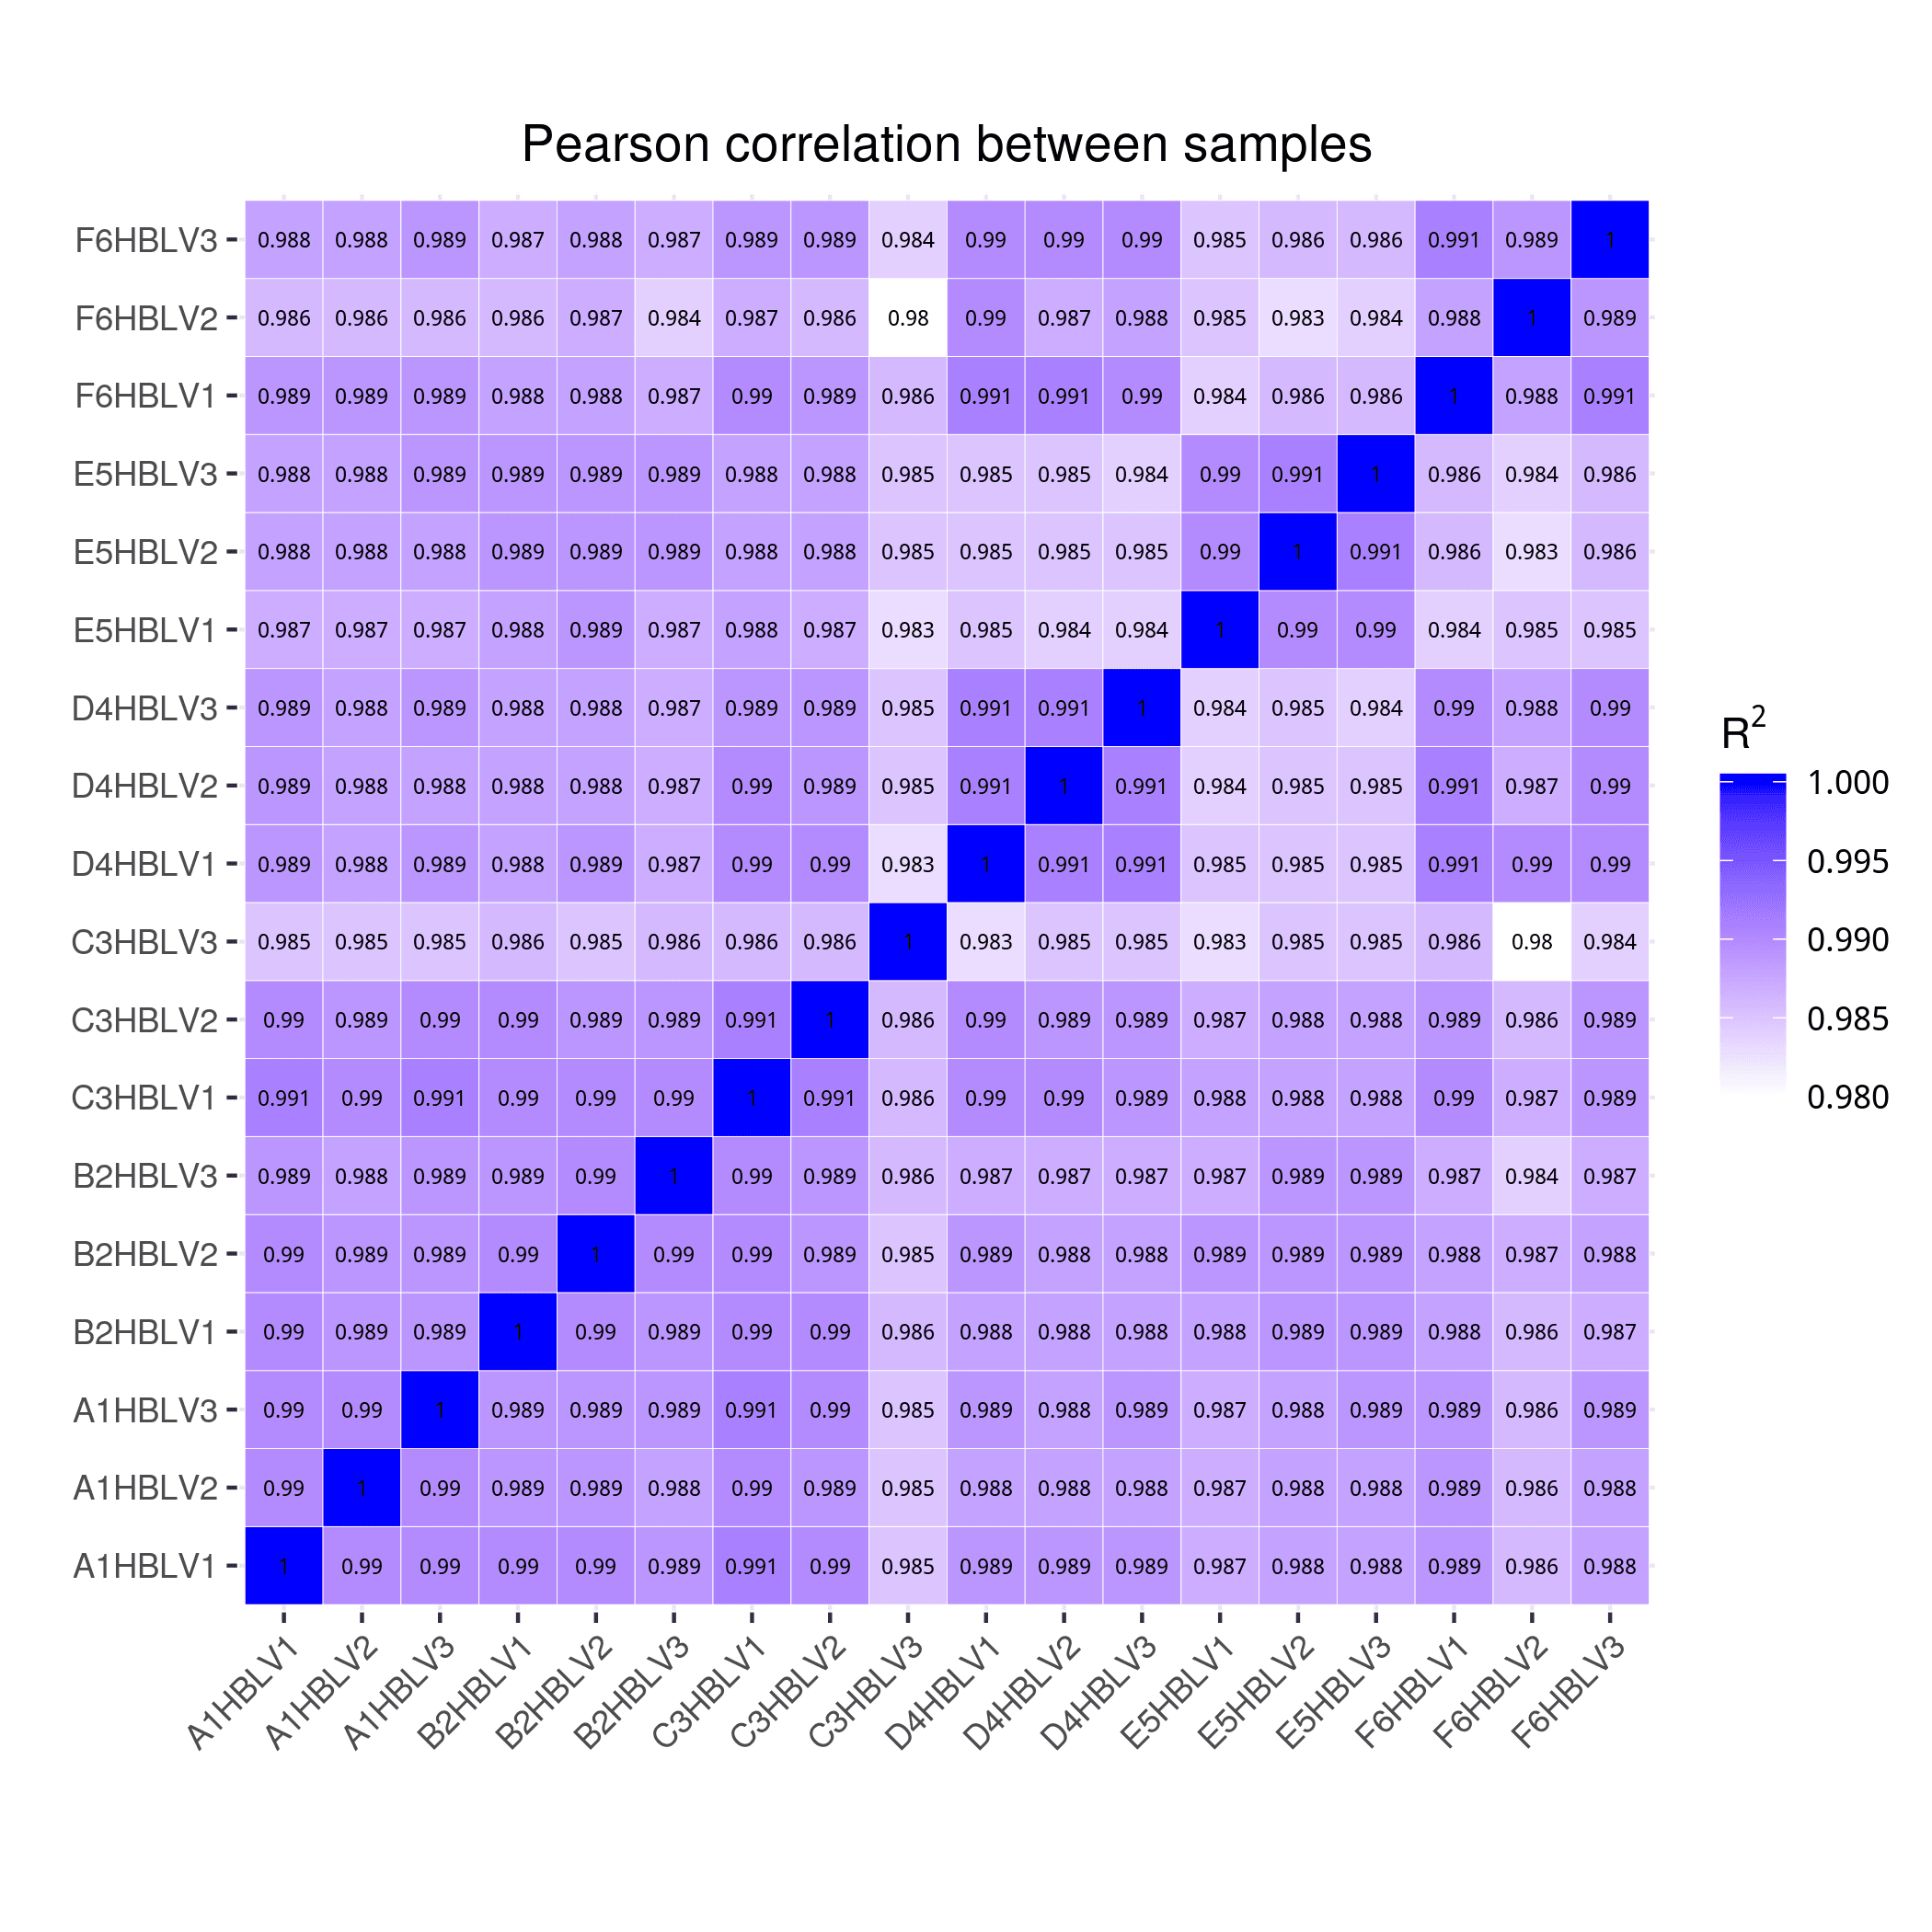
Sample Correlation Heatmap

Review correlation patterns between samples to assess data consistency and biological grouping.

Image
Image
1/1
Differential Gene Heatmap

Visualise expression patterns of differentially expressed genes across samples and experimental groups.

Image
Image
1/1
Expression Volcano Plot

Highlight significantly up- and down-regulated genes based on fold change and statistical significance.

Image
Image
1/1
Sample PCA

Assess overall expression profile variation and sample grouping across experimental conditions

Image
Image
1/1
Expression Pattern Clustering

Group genes with similar expression patterns to explore shared regulatory trends across samples.

Image
Image
1/1
KEGG Enrichment Analysis

Identify enriched pathways associated with differentially expressed genes for functional interpretation.

Image
Image
1/1
Sample Correlation Heatmap

Review correlation patterns between samples to assess data consistency and biological grouping.

Image
Image
1/1
Differential Gene Heatmap

Visualise expression patterns of differentially expressed genes across samples and experimental groups.

Image
Image
1/1
Expression Volcano Plot

Highlight significantly up- and down-regulated genes based on fold change and statistical significance.

Image
Image
1/1
Sample PCA

Assess overall expression profile variation and sample grouping across experimental conditions

Image
Image
1/1
Expression Pattern Clustering

Group genes with similar expression patterns to explore shared regulatory trends across samples.

Image
Image
1/1
KEGG Enrichment Analysis

Identify enriched pathways associated with differentially expressed genes for functional interpretation.

Image
Image
1/1
Sample Correlation Heatmap

Review correlation patterns between samples to assess data consistency and biological grouping.

Image
Image
1/1
Differential Gene Heatmap

Visualise expression patterns of differentially expressed genes across samples and experimental groups.

Image
Image
1/1
Expression Volcano Plot

Highlight significantly up- and down-regulated genes based on fold change and statistical significance.

Image
Image
1/1
Sample PCA

Assess overall expression profile variation and sample grouping across experimental conditions

Image
Image
1/1
Expression Pattern Clustering

Group genes with similar expression patterns to explore shared regulatory trends across samples.

Image
Image
1/1
KEGG Enrichment Analysis

Identify enriched pathways associated with differentially expressed genes for functional interpretation.

Image
Image
1/1
Sample Correlation Heatmap

Review correlation patterns between samples to assess data consistency and biological grouping.

Webinars

Exploring the Untranslated — RNA Sequencing Basics & the Power of lncRNA

Looking to get started with RNA-seq or expand your transcriptomics research beyond protein-coding genes? Join this webinar to explore RNA-seq and lncRNA-seq technologies, learn when to include lncRNAs in your study, and gain practical guidance for designing successful transcriptomics projects.

Learn More
(Exploring the Untranslated — RNA Sequencing Basics & the Power of lncRNA)
Exploring the Untranslated — RNA Sequencing Basics & the Power of lncRNA

Looking to get started with RNA-seq or expand your transcriptomics research beyond protein-coding genes? Join this webinar to explore RNA-seq and lncRNA-seq technologies, learn when to include lncRNAs in your study, and gain practical guidance for designing successful transcriptomics projects.

Learn More
(Exploring the Untranslated — RNA Sequencing Basics & the Power of lncRNA)
Exploring the Untranslated — RNA Sequencing Basics & the Power of lncRNA

Looking to get started with RNA-seq or expand your transcriptomics research beyond protein-coding genes? Join this webinar to explore RNA-seq and lncRNA-seq technologies, learn when to include lncRNAs in your study, and gain practical guidance for designing successful transcriptomics projects.

Learn More
(Exploring the Untranslated — RNA Sequencing Basics & the Power of lncRNA)
Exploring the Untranslated — RNA Sequencing Basics & the Power of lncRNA

Looking to get started with RNA-seq or expand your transcriptomics research beyond protein-coding genes? Join this webinar to explore RNA-seq and lncRNA-seq technologies, learn when to include lncRNAs in your study, and gain practical guidance for designing successful transcriptomics projects.

Learn More
(Exploring the Untranslated — RNA Sequencing Basics & the Power of lncRNA)

Frequently Asked Questions

How much data do I need for RNA-seq?

The required data depends on your research goals:

• Gene-level Differential Expression: ENCODE guidelines recommend approximately 30 million stranded reads per sample, although 20 million reads may be sufficient depending on the number of biological replicates.

• Low-Expression Gene Differentiation: Sequence 30–60 million reads per sample, with 30 million reads generally recommended as a starting point.

How many replicates are required?

What is the difference between strand-specific and non-strand-specific RNA-seq?

What precautions should I take when sending RNA samples?

What is the difference between RNA-seq and single-cell RNA-seq?

Explore Transcriptomics Insights

Access webinars, brochures and case studies covering sequencing technologies, study planning and data interpretation.
View Webinar Library
(Explore Transcriptomics Insights)
View Webinar Library
(Explore Transcriptomics Insights)
Background
Background

Speak with a Specialist

Have a project in mind?


Send us your enquiry and a Novogene Europe specialist will be in touch.


Privacy PolicyCookie PolicyTerms
banner laptop bg
banner mobile bg

mRNA Sequencing

Poly(A)-selected short-read mRNA sequencing for genome-wide gene expression analysis across eukaryotic samples and conditions.
OverviewOverview
BenefitsBenefits
ApplicationsApplications
SpecificationsSpecifications
ResourcesResources

mRNA sequencing, also known as mRNA-seq, profiles polyadenylated messenger RNA using short-read sequencing to measure gene expression across tissues, cell populations or experimental conditions. It provides a quantitative, genome-wide view of transcriptional activity, supporting differential expression analysis, pathway interpretation and functional genomics research.


Novogene Europe supports poly(A)-selected mRNA-seq projects using Illumina paired-end sequencing, established quality control and bioinformatics workflows for gene expression quantification, differential expression analysis, alternative splicing analysis and functional enrichment. The service can support studies across disease research, development, treatment response, biomarker discovery and broader multi-omics research.

Service Highlights

Poly(A)-selected mRNA Profiling

Profile polyadenylated messenger RNA using short-read sequencing to quantify coding transcript expression across eukaryotic samples and conditions.

Poly(A)-selected mRNA Profiling

Profile polyadenylated messenger RNA using short-read sequencing to quantify coding transcript expression across eukaryotic samples and conditions.

Quantitative Gene Expression Analysis

Measure gene expression levels across samples to support group comparison, expression pattern analysis and downstream biological interpretation.

Quantitative Gene Expression Analysis

Measure gene expression levels across samples to support group comparison, expression pattern analysis and downstream biological interpretation.

Bioinformatics and NovoMagic Support

Analyse differential expression, enrichment and visual outputs, with selected mRNA-seq results available through NovoMagic for online analysis and review.

Bioinformatics and NovoMagic Support

Analyse differential expression, enrichment and visual outputs, with selected mRNA-seq results available through NovoMagic for online analysis and review.

Scalable Study Support

Support expression profiling across sample groups, time points, treatments and biological conditions, with sequencing depth and analysis options adapted to project needs.

Scalable Study Support

Support expression profiling across sample groups, time points, treatments and biological conditions, with sequencing depth and analysis options adapted to project needs.

Service Highlights

Poly(A)-selected mRNA Profiling

Profile polyadenylated messenger RNA using short-read sequencing to quantify coding transcript expression across eukaryotic samples and conditions.

Poly(A)-selected mRNA Profiling

Profile polyadenylated messenger RNA using short-read sequencing to quantify coding transcript expression across eukaryotic samples and conditions.

Quantitative Gene Expression Analysis

Measure gene expression levels across samples to support group comparison, expression pattern analysis and downstream biological interpretation.

Quantitative Gene Expression Analysis

Measure gene expression levels across samples to support group comparison, expression pattern analysis and downstream biological interpretation.

Bioinformatics and NovoMagic Support

Analyse differential expression, enrichment and visual outputs, with selected mRNA-seq results available through NovoMagic for online analysis and review.

Bioinformatics and NovoMagic Support

Analyse differential expression, enrichment and visual outputs, with selected mRNA-seq results available through NovoMagic for online analysis and review.

Scalable Study Support

Support expression profiling across sample groups, time points, treatments and biological conditions, with sequencing depth and analysis options adapted to project needs.

Scalable Study Support

Support expression profiling across sample groups, time points, treatments and biological conditions, with sequencing depth and analysis options adapted to project needs.

Looking for full-length transcript information?

For isoform-level transcript structure, transcript discovery or detailed splice variant analysis, explore our Full-Length Transcriptome Sequencing service.

Applications

Gene Expression and Biological Response

mRNA-seq helps researchers study how gene activity changes across tissues, cell types, developmental stages, treatments or disease-related conditions.

Gene Expression and Biological Response

mRNA-seq helps researchers study how gene activity changes across tissues, cell types, developmental stages, treatments or disease-related conditions.

Pathway and Mechanism Research

Poly(A)-selected transcriptome data can reveal affected pathways, biological processes and gene networks, helping connect expression changes with biological mechanisms.

Pathway and Mechanism Research

Poly(A)-selected transcriptome data can reveal affected pathways, biological processes and gene networks, helping connect expression changes with biological mechanisms.

Biomarker and Expression Signature Discovery

mRNA-seq supports discovery of expression signatures associated with disease states, treatment response, developmental stages or other biological conditions.

Biomarker and Expression Signature Discovery

mRNA-seq supports discovery of expression signatures associated with disease states, treatment response, developmental stages or other biological conditions.

Cohort and Time-course Profiling

mRNA-seq supports scalable expression profiling across cohorts, time points, treatments and biological conditions, helping researchers compare gene activity across study designs.

Cohort and Time-course Profiling

mRNA-seq supports scalable expression profiling across cohorts, time points, treatments and biological conditions, helping researchers compare gene activity across study designs.

Applications

Gene Expression and Biological Response

mRNA-seq helps researchers study how gene activity changes across tissues, cell types, developmental stages, treatments or disease-related conditions.

Gene Expression and Biological Response

mRNA-seq helps researchers study how gene activity changes across tissues, cell types, developmental stages, treatments or disease-related conditions.

Pathway and Mechanism Research

Poly(A)-selected transcriptome data can reveal affected pathways, biological processes and gene networks, helping connect expression changes with biological mechanisms.

Pathway and Mechanism Research

Poly(A)-selected transcriptome data can reveal affected pathways, biological processes and gene networks, helping connect expression changes with biological mechanisms.

Biomarker and Expression Signature Discovery

mRNA-seq supports discovery of expression signatures associated with disease states, treatment response, developmental stages or other biological conditions.

Biomarker and Expression Signature Discovery

mRNA-seq supports discovery of expression signatures associated with disease states, treatment response, developmental stages or other biological conditions.

Cohort and Time-course Profiling

mRNA-seq supports scalable expression profiling across cohorts, time points, treatments and biological conditions, helping researchers compare gene activity across study designs.

Cohort and Time-course Profiling

mRNA-seq supports scalable expression profiling across cohorts, time points, treatments and biological conditions, helping researchers compare gene activity across study designs.

Specifications

Sample Requirements

The quantities listed are provided for reference only. Please download the Sample Requirements for detailed guidance, or contact us to discuss your project-specific requirements.

ServiceSample TypeAmount (Qubit®)VolumeConcentrationRIN (Agilent 5400)Purity (NanoDrop™)
Eukaryotic mRNA
(polyA enrichment)
Total RNA (animal)≥100 ng≥10 μL≥10 ng/μL≥4.0, with flat baselineOD260/280 = 1.8-2.2;
OD260/230 ≥ 2.0;
no degradation,
no contamination
Total RNA
(plant, fungus)
≥100 ng≥10 μL≥10 ng/μL≥4.0, with flat baseline
Total RNA (blood)≥400 ng≥20 μL≥20 ng/μL≥5.0, with flat baseline
Strand-specific Eukaryotic mRNA
(polyA enrichment)
Total RNA (animal)≥200 ng≥10 μL≥20 ng/μL≥5.0, with flat baseline
Total RNA (plant, fungus)≥200 ng≥10 μL≥20 ng/μL≥5.0, with flat baseline
Total RNA (blood)≥400 ng≥20 μL≥20 ng/μL≥5.0, with flat baseline

Sample Requirements

The quantities listed are provided for reference only. Please download the Sample Requirements for detailed guidance, or contact us to discuss your project-specific requirements.

ServiceSample TypeAmount (Qubit®)VolumeConcentrationRIN (Agilent 5400)Purity (NanoDrop™)
Eukaryotic mRNA
(polyA enrichment)
Total RNA (animal)≥100 ng≥10 μL≥10 ng/μL≥4.0, with flat baselineOD260/280 = 1.8-2.2;
OD260/230 ≥ 2.0;
no degradation,
no contamination
Total RNA
(plant, fungus)
≥100 ng≥10 μL≥10 ng/μL≥4.0, with flat baseline
Total RNA (blood)≥400 ng≥20 μL≥20 ng/μL≥5.0, with flat baseline
Strand-specific Eukaryotic mRNA
(polyA enrichment)
Total RNA (animal)≥200 ng≥10 μL≥20 ng/μL≥5.0, with flat baseline
Total RNA (plant, fungus)≥200 ng≥10 μL≥20 ng/μL≥5.0, with flat baseline
Total RNA (blood)≥400 ng≥20 μL≥20 ng/μL≥5.0, with flat baseline

Sample Requirements

The quantities listed are provided for reference only. Please download the Sample Requirements for detailed guidance, or contact us to discuss your project-specific requirements.

ServiceSample TypeAmount (Qubit®)VolumeConcentrationRIN (Agilent 5400)Purity (NanoDrop™)
Eukaryotic mRNA
(polyA enrichment)
Total RNA (animal)≥100 ng≥10 μL≥10 ng/μL≥4.0, with flat baselineOD260/280 = 1.8-2.2;
OD260/230 ≥ 2.0;
no degradation,
no contamination
Total RNA
(plant, fungus)
≥100 ng≥10 μL≥10 ng/μL≥4.0, with flat baseline
Total RNA (blood)≥400 ng≥20 μL≥20 ng/μL≥5.0, with flat baseline
Strand-specific Eukaryotic mRNA
(polyA enrichment)
Total RNA (animal)≥200 ng≥10 μL≥20 ng/μL≥5.0, with flat baseline
Total RNA (plant, fungus)≥200 ng≥10 μL≥20 ng/μL≥5.0, with flat baseline
Total RNA (blood)≥400 ng≥20 μL≥20 ng/μL≥5.0, with flat baseline

Sample Requirements

The quantities listed are provided for reference only. Please download the Sample Requirements for detailed guidance, or contact us to discuss your project-specific requirements.

ServiceSample TypeAmount (Qubit®)VolumeConcentrationRIN (Agilent 5400)Purity (NanoDrop™)
Eukaryotic mRNA
(polyA enrichment)
Total RNA (animal)≥100 ng≥10 μL≥10 ng/μL≥4.0, with flat baselineOD260/280 = 1.8-2.2;
OD260/230 ≥ 2.0;
no degradation,
no contamination
Total RNA
(plant, fungus)
≥100 ng≥10 μL≥10 ng/μL≥4.0, with flat baseline
Total RNA (blood)≥400 ng≥20 μL≥20 ng/μL≥5.0, with flat baseline
Strand-specific Eukaryotic mRNA
(polyA enrichment)
Total RNA (animal)≥200 ng≥10 μL≥20 ng/μL≥5.0, with flat baseline
Total RNA (plant, fungus)≥200 ng≥10 μL≥20 ng/μL≥5.0, with flat baseline
Total RNA (blood)≥400 ng≥20 μL≥20 ng/μL≥5.0, with flat baseline

Sequencing and Analysis

Recommended data outputs and analysis contents displayed are for reference only. For detailed information, please contact us with your customized requests.

Sequencing PlatformIllumina NovaSeq X-Plus Sequencing Platform
Read LengthPaired-end 150 bp
Recommended Data Output≥ 20 million read pairs per sample for species with reference genome≥ 50 million read pairs per sample for species without reference genome (de novo transcriptome assembly projects)
Data Analysis CapabilityData quality control
Gene expression quantification
Differential expression profiling
SNP & InDel analysis
Alternative splicing analysis
Functional enrichment analysis like GO, KEGG, Protein-protein interaction (PPI) analysis, etc.
Note: Recommended data outputs and analysis contents displayed are for reference only. Download the Service Specifications to learn more. For detailed information, please contact us with your customized requests.

Sequencing and Analysis

Recommended data outputs and analysis contents displayed are for reference only. For detailed information, please contact us with your customized requests.

Sequencing PlatformIllumina NovaSeq X-Plus Sequencing Platform
Read LengthPaired-end 150 bp
Recommended Data Output≥ 20 million read pairs per sample for species with reference genome≥ 50 million read pairs per sample for species without reference genome (de novo transcriptome assembly projects)
Data Analysis CapabilityData quality control
Gene expression quantification
Differential expression profiling
SNP & InDel analysis
Alternative splicing analysis
Functional enrichment analysis like GO, KEGG, Protein-protein interaction (PPI) analysis, etc.
Note: Recommended data outputs and analysis contents displayed are for reference only. Download the Service Specifications to learn more. For detailed information, please contact us with your customized requests.

Sequencing and Analysis

Recommended data outputs and analysis contents displayed are for reference only. For detailed information, please contact us with your customized requests.

Sequencing PlatformIllumina NovaSeq X-Plus Sequencing Platform
Read LengthPaired-end 150 bp
Recommended Data Output≥ 20 million read pairs per sample for species with reference genome≥ 50 million read pairs per sample for species without reference genome (de novo transcriptome assembly projects)
Data Analysis CapabilityData quality control
Gene expression quantification
Differential expression profiling
SNP & InDel analysis
Alternative splicing analysis
Functional enrichment analysis like GO, KEGG, Protein-protein interaction (PPI) analysis, etc.
Note: Recommended data outputs and analysis contents displayed are for reference only. Download the Service Specifications to learn more. For detailed information, please contact us with your customized requests.

Sequencing and Analysis

Recommended data outputs and analysis contents displayed are for reference only. For detailed information, please contact us with your customized requests.

Sequencing PlatformIllumina NovaSeq X-Plus Sequencing Platform
Read LengthPaired-end 150 bp
Recommended Data Output≥ 20 million read pairs per sample for species with reference genome≥ 50 million read pairs per sample for species without reference genome (de novo transcriptome assembly projects)
Data Analysis CapabilityData quality control
Gene expression quantification
Differential expression profiling
SNP & InDel analysis
Alternative splicing analysis
Functional enrichment analysis like GO, KEGG, Protein-protein interaction (PPI) analysis, etc.
Note: Recommended data outputs and analysis contents displayed are for reference only. Download the Service Specifications to learn more. For detailed information, please contact us with your customized requests.

Specifications

Sample Requirements

The quantities listed are provided for reference only. Please download the Sample Requirements for detailed guidance, or contact us to discuss your project-specific requirements.

ServiceSample TypeAmount (Qubit®)VolumeConcentrationRIN (Agilent 5400)Purity (NanoDrop™)
Eukaryotic mRNA
(polyA enrichment)
Total RNA (animal)≥100 ng≥10 μL≥10 ng/μL≥4.0, with flat baselineOD260/280 = 1.8-2.2;
OD260/230 ≥ 2.0;
no degradation,
no contamination
Total RNA
(plant, fungus)
≥100 ng≥10 μL≥10 ng/μL≥4.0, with flat baseline
Total RNA (blood)≥400 ng≥20 μL≥20 ng/μL≥5.0, with flat baseline
Strand-specific Eukaryotic mRNA
(polyA enrichment)
Total RNA (animal)≥200 ng≥10 μL≥20 ng/μL≥5.0, with flat baseline
Total RNA (plant, fungus)≥200 ng≥10 μL≥20 ng/μL≥5.0, with flat baseline
Total RNA (blood)≥400 ng≥20 μL≥20 ng/μL≥5.0, with flat baseline

Sample Requirements

The quantities listed are provided for reference only. Please download the Sample Requirements for detailed guidance, or contact us to discuss your project-specific requirements.

ServiceSample TypeAmount (Qubit®)VolumeConcentrationRIN (Agilent 5400)Purity (NanoDrop™)
Eukaryotic mRNA
(polyA enrichment)
Total RNA (animal)≥100 ng≥10 μL≥10 ng/μL≥4.0, with flat baselineOD260/280 = 1.8-2.2;
OD260/230 ≥ 2.0;
no degradation,
no contamination
Total RNA
(plant, fungus)
≥100 ng≥10 μL≥10 ng/μL≥4.0, with flat baseline
Total RNA (blood)≥400 ng≥20 μL≥20 ng/μL≥5.0, with flat baseline
Strand-specific Eukaryotic mRNA
(polyA enrichment)
Total RNA (animal)≥200 ng≥10 μL≥20 ng/μL≥5.0, with flat baseline
Total RNA (plant, fungus)≥200 ng≥10 μL≥20 ng/μL≥5.0, with flat baseline
Total RNA (blood)≥400 ng≥20 μL≥20 ng/μL≥5.0, with flat baseline

Sample Requirements

The quantities listed are provided for reference only. Please download the Sample Requirements for detailed guidance, or contact us to discuss your project-specific requirements.

ServiceSample TypeAmount (Qubit®)VolumeConcentrationRIN (Agilent 5400)Purity (NanoDrop™)
Eukaryotic mRNA
(polyA enrichment)
Total RNA (animal)≥100 ng≥10 μL≥10 ng/μL≥4.0, with flat baselineOD260/280 = 1.8-2.2;
OD260/230 ≥ 2.0;
no degradation,
no contamination
Total RNA
(plant, fungus)
≥100 ng≥10 μL≥10 ng/μL≥4.0, with flat baseline
Total RNA (blood)≥400 ng≥20 μL≥20 ng/μL≥5.0, with flat baseline
Strand-specific Eukaryotic mRNA
(polyA enrichment)
Total RNA (animal)≥200 ng≥10 μL≥20 ng/μL≥5.0, with flat baseline
Total RNA (plant, fungus)≥200 ng≥10 μL≥20 ng/μL≥5.0, with flat baseline
Total RNA (blood)≥400 ng≥20 μL≥20 ng/μL≥5.0, with flat baseline

Sample Requirements

The quantities listed are provided for reference only. Please download the Sample Requirements for detailed guidance, or contact us to discuss your project-specific requirements.

ServiceSample TypeAmount (Qubit®)VolumeConcentrationRIN (Agilent 5400)Purity (NanoDrop™)
Eukaryotic mRNA
(polyA enrichment)
Total RNA (animal)≥100 ng≥10 μL≥10 ng/μL≥4.0, with flat baselineOD260/280 = 1.8-2.2;
OD260/230 ≥ 2.0;
no degradation,
no contamination
Total RNA
(plant, fungus)
≥100 ng≥10 μL≥10 ng/μL≥4.0, with flat baseline
Total RNA (blood)≥400 ng≥20 μL≥20 ng/μL≥5.0, with flat baseline
Strand-specific Eukaryotic mRNA
(polyA enrichment)
Total RNA (animal)≥200 ng≥10 μL≥20 ng/μL≥5.0, with flat baseline
Total RNA (plant, fungus)≥200 ng≥10 μL≥20 ng/μL≥5.0, with flat baseline
Total RNA (blood)≥400 ng≥20 μL≥20 ng/μL≥5.0, with flat baseline

Sequencing and Analysis

Recommended data outputs and analysis contents displayed are for reference only. For detailed information, please contact us with your customized requests.

Sequencing PlatformIllumina NovaSeq X-Plus Sequencing Platform
Read LengthPaired-end 150 bp
Recommended Data Output≥ 20 million read pairs per sample for species with reference genome≥ 50 million read pairs per sample for species without reference genome (de novo transcriptome assembly projects)
Data Analysis CapabilityData quality control
Gene expression quantification
Differential expression profiling
SNP & InDel analysis
Alternative splicing analysis
Functional enrichment analysis like GO, KEGG, Protein-protein interaction (PPI) analysis, etc.
Note: Recommended data outputs and analysis contents displayed are for reference only. Download the Service Specifications to learn more. For detailed information, please contact us with your customized requests.

Sequencing and Analysis

Recommended data outputs and analysis contents displayed are for reference only. For detailed information, please contact us with your customized requests.

Sequencing PlatformIllumina NovaSeq X-Plus Sequencing Platform
Read LengthPaired-end 150 bp
Recommended Data Output≥ 20 million read pairs per sample for species with reference genome≥ 50 million read pairs per sample for species without reference genome (de novo transcriptome assembly projects)
Data Analysis CapabilityData quality control
Gene expression quantification
Differential expression profiling
SNP & InDel analysis
Alternative splicing analysis
Functional enrichment analysis like GO, KEGG, Protein-protein interaction (PPI) analysis, etc.
Note: Recommended data outputs and analysis contents displayed are for reference only. Download the Service Specifications to learn more. For detailed information, please contact us with your customized requests.

Sequencing and Analysis

Recommended data outputs and analysis contents displayed are for reference only. For detailed information, please contact us with your customized requests.

Sequencing PlatformIllumina NovaSeq X-Plus Sequencing Platform
Read LengthPaired-end 150 bp
Recommended Data Output≥ 20 million read pairs per sample for species with reference genome≥ 50 million read pairs per sample for species without reference genome (de novo transcriptome assembly projects)
Data Analysis CapabilityData quality control
Gene expression quantification
Differential expression profiling
SNP & InDel analysis
Alternative splicing analysis
Functional enrichment analysis like GO, KEGG, Protein-protein interaction (PPI) analysis, etc.
Note: Recommended data outputs and analysis contents displayed are for reference only. Download the Service Specifications to learn more. For detailed information, please contact us with your customized requests.

Sequencing and Analysis

Recommended data outputs and analysis contents displayed are for reference only. For detailed information, please contact us with your customized requests.

Sequencing PlatformIllumina NovaSeq X-Plus Sequencing Platform
Read LengthPaired-end 150 bp
Recommended Data Output≥ 20 million read pairs per sample for species with reference genome≥ 50 million read pairs per sample for species without reference genome (de novo transcriptome assembly projects)
Data Analysis CapabilityData quality control
Gene expression quantification
Differential expression profiling
SNP & InDel analysis
Alternative splicing analysis
Functional enrichment analysis like GO, KEGG, Protein-protein interaction (PPI) analysis, etc.
Note: Recommended data outputs and analysis contents displayed are for reference only. Download the Service Specifications to learn more. For detailed information, please contact us with your customized requests.

Resources

Example Analysis Output

Image
Image
1/1
Differential Gene Heatmap

Visualise expression patterns of differentially expressed genes across samples and experimental groups.

Image
Image
1/1
Expression Volcano Plot

Highlight significantly up- and down-regulated genes based on fold change and statistical significance.

Image
Image
1/1
Sample PCA

Assess overall expression profile variation and sample grouping across experimental conditions

Image
Image
1/1
Expression Pattern Clustering

Group genes with similar expression patterns to explore shared regulatory trends across samples.

Image
Image
1/1
KEGG Enrichment Analysis

Identify enriched pathways associated with differentially expressed genes for functional interpretation.

Image
Image
1/1
Sample Correlation Heatmap

Review correlation patterns between samples to assess data consistency and biological grouping.

Image
Image
1/1
Differential Gene Heatmap

Visualise expression patterns of differentially expressed genes across samples and experimental groups.

Image
Image
1/1
Expression Volcano Plot

Highlight significantly up- and down-regulated genes based on fold change and statistical significance.

Image
Image
1/1
Sample PCA

Assess overall expression profile variation and sample grouping across experimental conditions

Image
Image
1/1
Expression Pattern Clustering

Group genes with similar expression patterns to explore shared regulatory trends across samples.

Image
Image
1/1
KEGG Enrichment Analysis

Identify enriched pathways associated with differentially expressed genes for functional interpretation.

Image
Image
1/1
Sample Correlation Heatmap

Review correlation patterns between samples to assess data consistency and biological grouping.

Image
Image
1/1
Differential Gene Heatmap

Visualise expression patterns of differentially expressed genes across samples and experimental groups.

Image
Image
1/1
Expression Volcano Plot

Highlight significantly up- and down-regulated genes based on fold change and statistical significance.

Image
Image
1/1
Sample PCA

Assess overall expression profile variation and sample grouping across experimental conditions

Image
Image
1/1
Expression Pattern Clustering

Group genes with similar expression patterns to explore shared regulatory trends across samples.

Image
Image
1/1
KEGG Enrichment Analysis

Identify enriched pathways associated with differentially expressed genes for functional interpretation.

Image
Image
1/1
Sample Correlation Heatmap

Review correlation patterns between samples to assess data consistency and biological grouping.

Image
Image
1/1
Differential Gene Heatmap

Visualise expression patterns of differentially expressed genes across samples and experimental groups.

Image
Image
1/1
Expression Volcano Plot

Highlight significantly up- and down-regulated genes based on fold change and statistical significance.

Image
Image
1/1
Sample PCA

Assess overall expression profile variation and sample grouping across experimental conditions

Image
Image
1/1
Expression Pattern Clustering

Group genes with similar expression patterns to explore shared regulatory trends across samples.

Image
Image
1/1
KEGG Enrichment Analysis

Identify enriched pathways associated with differentially expressed genes for functional interpretation.

Image
Image
1/1
Sample Correlation Heatmap

Review correlation patterns between samples to assess data consistency and biological grouping.

Webinars

Exploring the Untranslated — RNA Sequencing Basics & the Power of lncRNA

Looking to get started with RNA-seq or expand your transcriptomics research beyond protein-coding genes? Join this webinar to explore RNA-seq and lncRNA-seq technologies, learn when to include lncRNAs in your study, and gain practical guidance for designing successful transcriptomics projects.

Learn More
(Exploring the Untranslated — RNA Sequencing Basics & the Power of lncRNA)
Exploring the Untranslated — RNA Sequencing Basics & the Power of lncRNA

Looking to get started with RNA-seq or expand your transcriptomics research beyond protein-coding genes? Join this webinar to explore RNA-seq and lncRNA-seq technologies, learn when to include lncRNAs in your study, and gain practical guidance for designing successful transcriptomics projects.

Learn More
(Exploring the Untranslated — RNA Sequencing Basics & the Power of lncRNA)
Exploring the Untranslated — RNA Sequencing Basics & the Power of lncRNA

Looking to get started with RNA-seq or expand your transcriptomics research beyond protein-coding genes? Join this webinar to explore RNA-seq and lncRNA-seq technologies, learn when to include lncRNAs in your study, and gain practical guidance for designing successful transcriptomics projects.

Learn More
(Exploring the Untranslated — RNA Sequencing Basics & the Power of lncRNA)
Exploring the Untranslated — RNA Sequencing Basics & the Power of lncRNA

Looking to get started with RNA-seq or expand your transcriptomics research beyond protein-coding genes? Join this webinar to explore RNA-seq and lncRNA-seq technologies, learn when to include lncRNAs in your study, and gain practical guidance for designing successful transcriptomics projects.

Learn More
(Exploring the Untranslated — RNA Sequencing Basics & the Power of lncRNA)

Frequently Asked Questions

How much data do I need for RNA-seq?

The required data depends on your research goals:

• Gene-level Differential Expression: ENCODE guidelines recommend approximately 30 million stranded reads per sample, although 20 million reads may be sufficient depending on the number of biological replicates.

• Low-Expression Gene Differentiation: Sequence 30–60 million reads per sample, with 30 million reads generally recommended as a starting point.

How many replicates are required?

What is the difference between strand-specific and non-strand-specific RNA-seq?

What precautions should I take when sending RNA samples?

What is the difference between RNA-seq and single-cell RNA-seq?

Explore Transcriptomics Insights

Access webinars, brochures and case studies covering sequencing technologies, study planning and data interpretation.
View Webinar Library
(Explore Transcriptomics Insights)
View Webinar Library
(Explore Transcriptomics Insights)
Background
Background

Speak with a Specialist

Have a project in mind?


Send us your enquiry and a Novogene Europe specialist will be in touch.


Privacy PolicyCookie PolicyTerms