
• Cart
    • Quote
    • Enquiry
    • Cart
    • Quote
    • Enquiry
Novogene Europe
  • Novogene Europe
  • Genomics
    • Human Whole Genome Sequencing
    • Whole Exome Sequencing
    • Plant and Animal Whole Genome Sequencing
    • Plant and Animal De novo Sequencing
    • Microbial Whole Genome Sequencing
    • Microbial De novo Sequencing
    • Whole Plasmid SequencingOrder Online!
    Proteomics
    • Olink ProteomicsNew!
    Epigenomics
    • DNA Methylation SequencingUpdated!
    • Chromatin Immunoprecipitation Sequencing (ChIP-seq)
    • RNA Immunoprecipitation Sequencing (RIP-seq)
    Metabolomics
    • Untargeted MetabolomicsComing Soon!
    Transcriptomics
    • mRNA Sequencing
    • Small RNA Sequencing (sRNA‑seq)
    • Circular RNA Sequencing (circRNA-seq)
    • Total RNA Sequencing
    • Whole Transcriptome Sequencing
    • Full-Length Transcriptome Sequencing
    • Prokaryotic RNA Sequencing
    • Metatranscriptome Sequencing
    Metagenomics
    • Amplicon SequencingOrder Online!
    • Shotgun Metagenomics Sequencing
    Single Cell & Spatial Omics
    • 10X Single Cell Gene Expression
    • 10X Single Cell Immune Profiling
    • 10X Visium HD Spatial Gene Expression
    Premade Library
    • Sequencing Only on Illumina® Sequencer
    • Sequencing Only on Element SequencerNew!
    • Sequencing Only on PacBio Sequencer
    Translational Research
    • Accredited & Validated Clinical Research Sequencing
  • PromotionsPromotions
    • Platforms
    • Automated Delivery Platform (Falcon)
    • Bioinformatics Analysis Tool (NovoMagic)
    • Customer Service System (CSS)
    • Customer Support
    • Webinars
    • Case Study
    • Blog
    • Brochure
    • Cancer Research
    • Immuno-oncology
    • Agrigenomics
    • Environment
    • Food Science
    • Human Microbiome
    • Plant and Animal Microbiome
    • Drug Discovery and Development
    • Rare and Complex Diseases
    • About Us
    • News & Events
    • Careers
    • Our Locations
  • Contact UsContact Us
    • Amplicon Sequencing
    • Whole Plasmid Sequencing

ServicesServices menu

ResourcesResources menu

SupportSupport menu

CompanyCompany menu

Services
Human Whole Genome SequencingWhole Exome SequencingPlant and Animal Whole Genome SequencingPlant and Animal De novo SequencingDNA Methylation SequencingmRNA SequencingFull-Length Transcriptome SequencingWhole Transcriptome SequencingMetatranscriptome SequencingShotgun Metagenomics SequencingAmplicon SequencingWhole Plasmid Sequencing10X Single Cell Gene Expression10X Single Cell Immune Profiling10X Visium HD Spatial Gene ExpressionOlink ProteomicsUntargeted MetabolomicsAccredited & Validated Clinical Research Sequencing
Resources
WebinarsCase StudyBlogBrochure
Support
PlatformBioinformatics Analysis Tool (NovoMagic)Customer Service System (CSS)Customer Support
Company
About UsNews & EventsLocationContact Us
LinkedInLinkedIn hoverYouTubeYouTube hoverInstagramInstagram hoverXX hover
Copyright © 2026 Novogene Inc. All rights reserved.For Research Use Only. Not for Clinical Diagnostic Use.
    • Cart
    • Quote
    • Enquiry
    • Cart
    • Quote
    • Enquiry
Novogene Europe
  • Novogene Europe
  • Genomics
    • Human Whole Genome Sequencing
    • Whole Exome Sequencing
    • Plant and Animal Whole Genome Sequencing
    • Plant and Animal De novo Sequencing
    • Microbial Whole Genome Sequencing
    • Microbial De novo Sequencing
    • Whole Plasmid SequencingOrder Online!
    Proteomics
    • Olink ProteomicsNew!
    Epigenomics
    • DNA Methylation SequencingUpdated!
    • Chromatin Immunoprecipitation Sequencing (ChIP-seq)
    • RNA Immunoprecipitation Sequencing (RIP-seq)
    Metabolomics
    • Untargeted MetabolomicsComing Soon!
    Transcriptomics
    • mRNA Sequencing
    • Small RNA Sequencing (sRNA‑seq)
    • Circular RNA Sequencing (circRNA-seq)
    • Total RNA Sequencing
    • Whole Transcriptome Sequencing
    • Full-Length Transcriptome Sequencing
    • Prokaryotic RNA Sequencing
    • Metatranscriptome Sequencing
    Metagenomics
    • Amplicon SequencingOrder Online!
    • Shotgun Metagenomics Sequencing
    Single Cell & Spatial Omics
    • 10X Single Cell Gene Expression
    • 10X Single Cell Immune Profiling
    • 10X Visium HD Spatial Gene Expression
    Premade Library
    • Sequencing Only on Illumina® Sequencer
    • Sequencing Only on Element SequencerNew!
    • Sequencing Only on PacBio Sequencer
    Translational Research
    • Accredited & Validated Clinical Research Sequencing
  • PromotionsPromotions
    • Platforms
    • Automated Delivery Platform (Falcon)
    • Bioinformatics Analysis Tool (NovoMagic)
    • Customer Service System (CSS)
    • Customer Support
    • Webinars
    • Case Study
    • Blog
    • Brochure
    • Cancer Research
    • Immuno-oncology
    • Agrigenomics
    • Environment
    • Food Science
    • Human Microbiome
    • Plant and Animal Microbiome
    • Drug Discovery and Development
    • Rare and Complex Diseases
    • About Us
    • News & Events
    • Careers
    • Our Locations
  • Contact UsContact Us
    • Amplicon Sequencing
    • Whole Plasmid Sequencing

ServicesServices menu

ResourcesResources menu

SupportSupport menu

CompanyCompany menu

Services
Human Whole Genome SequencingWhole Exome SequencingPlant and Animal Whole Genome SequencingPlant and Animal De novo SequencingDNA Methylation SequencingmRNA SequencingFull-Length Transcriptome SequencingWhole Transcriptome SequencingMetatranscriptome SequencingShotgun Metagenomics SequencingAmplicon SequencingWhole Plasmid Sequencing10X Single Cell Gene Expression10X Single Cell Immune Profiling10X Visium HD Spatial Gene ExpressionOlink ProteomicsUntargeted MetabolomicsAccredited & Validated Clinical Research Sequencing
Resources
WebinarsCase StudyBlogBrochure
Support
PlatformBioinformatics Analysis Tool (NovoMagic)Customer Service System (CSS)Customer Support
Company
About UsNews & EventsLocationContact Us
LinkedInLinkedIn hoverYouTubeYouTube hoverInstagramInstagram hoverXX hover
Copyright © 2026 Novogene Inc. All rights reserved.For Research Use Only. Not for Clinical Diagnostic Use.
banner laptop bg
banner mobile bg

Spatial Gene Expression

High-resolution spatial transcriptomics for mapping whole-transcriptome gene expression within tissue architecture, morphology and spatial biological context.
OverviewOverview
BenefitsBenefits
ApplicationsApplications
SpecificationsSpecifications

Spatial gene expression analysis enables researchers to explore where genes are expressed within tissue, helping connect transcriptomic profiles with tissue morphology and spatial organisation. This approach can support studies of complex tissues, cellular neighbourhoods and region-specific biological patterns that may be missed by dissociated single-cell or bulk RNA-seq methods.


Novogene Europe provides Visium HD spatial gene expression services using 10x Genomics CytAssist-enabled workflows. The service supports high-resolution, whole-transcriptome spatial profiling for compatible human and mouse tissue samples, including FFPE and fresh frozen tissue, with downstream analysis to visualise gene expression patterns within tissue context.

Service Highlights

Visium HD Spatial Profiling

High-resolution whole-transcriptome spatial gene expression analysis to explore gene activity within tissue architecture and spatial biological context.

Visium HD Spatial Profiling

High-resolution whole-transcriptome spatial gene expression analysis to explore gene activity within tissue architecture and spatial biological context.

FFPE and Fresh Frozen Support

Workflow options for compatible human and mouse FFPE or fresh frozen tissue samples, depending on tissue quality and project requirements.

FFPE and Fresh Frozen Support

Workflow options for compatible human and mouse FFPE or fresh frozen tissue samples, depending on tissue quality and project requirements.

CytAssist-enabled Workflow

10x Genomics CytAssist technology supports probe transfer from tissue slides to Visium slides, helping preserve spatial information during library preparation.

CytAssist-enabled Workflow

10x Genomics CytAssist technology supports probe transfer from tissue slides to Visium slides, helping preserve spatial information during library preparation.

Spatial Bioinformatics Analysis

Analysis outputs can include data QC, mapping, clustering, spatial gene expression visualisation, differential expression and functional enrichment analysis.

Spatial Bioinformatics Analysis

Analysis outputs can include data QC, mapping, clustering, spatial gene expression visualisation, differential expression and functional enrichment analysis.

Service Highlights

Visium HD Spatial Profiling

High-resolution whole-transcriptome spatial gene expression analysis to explore gene activity within tissue architecture and spatial biological context.

Visium HD Spatial Profiling

High-resolution whole-transcriptome spatial gene expression analysis to explore gene activity within tissue architecture and spatial biological context.

FFPE and Fresh Frozen Support

Workflow options for compatible human and mouse FFPE or fresh frozen tissue samples, depending on tissue quality and project requirements.

FFPE and Fresh Frozen Support

Workflow options for compatible human and mouse FFPE or fresh frozen tissue samples, depending on tissue quality and project requirements.

CytAssist-enabled Workflow

10x Genomics CytAssist technology supports probe transfer from tissue slides to Visium slides, helping preserve spatial information during library preparation.

CytAssist-enabled Workflow

10x Genomics CytAssist technology supports probe transfer from tissue slides to Visium slides, helping preserve spatial information during library preparation.

Spatial Bioinformatics Analysis

Analysis outputs can include data QC, mapping, clustering, spatial gene expression visualisation, differential expression and functional enrichment analysis.

Spatial Bioinformatics Analysis

Analysis outputs can include data QC, mapping, clustering, spatial gene expression visualisation, differential expression and functional enrichment analysis.

Applications

Tissue Architecture Mapping

Profile spatial relationships between tumour, immune and stromal regions to investigate cancer tissue heterogeneity, immune contexture and disease-associated gene expression.

Tissue Architecture Mapping

Profile spatial relationships between tumour, immune and stromal regions to investigate cancer tissue heterogeneity, immune contexture and disease-associated gene expression.

Tumour Microenvironment Studies

Profile spatial relationships between tumour, immune and stromal regions to investigate cancer tissue heterogeneity, immune contexture and disease-associated gene expression.

Tumour Microenvironment Studies

Profile spatial relationships between tumour, immune and stromal regions to investigate cancer tissue heterogeneity, immune contexture and disease-associated gene expression.

Development and Disease Models

Study spatial gene expression changes across developmental stages, neurological models, inflammatory disease models or treatment conditions.

Development and Disease Models

Study spatial gene expression changes across developmental stages, neurological models, inflammatory disease models or treatment conditions.

Cell Neighbourhood Analysis

Investigate localised gene expression patterns and cellular neighbourhoods, including tumour-immune interfaces and disease-associated tissue regions.

Cell Neighbourhood Analysis

Investigate localised gene expression patterns and cellular neighbourhoods, including tumour-immune interfaces and disease-associated tissue regions.

Applications

Tissue Architecture Mapping

Profile spatial relationships between tumour, immune and stromal regions to investigate cancer tissue heterogeneity, immune contexture and disease-associated gene expression.

Tissue Architecture Mapping

Profile spatial relationships between tumour, immune and stromal regions to investigate cancer tissue heterogeneity, immune contexture and disease-associated gene expression.

Tumour Microenvironment Studies

Profile spatial relationships between tumour, immune and stromal regions to investigate cancer tissue heterogeneity, immune contexture and disease-associated gene expression.

Tumour Microenvironment Studies

Profile spatial relationships between tumour, immune and stromal regions to investigate cancer tissue heterogeneity, immune contexture and disease-associated gene expression.

Development and Disease Models

Study spatial gene expression changes across developmental stages, neurological models, inflammatory disease models or treatment conditions.

Development and Disease Models

Study spatial gene expression changes across developmental stages, neurological models, inflammatory disease models or treatment conditions.

Cell Neighbourhood Analysis

Investigate localised gene expression patterns and cellular neighbourhoods, including tumour-immune interfaces and disease-associated tissue regions.

Cell Neighbourhood Analysis

Investigate localised gene expression patterns and cellular neighbourhoods, including tumour-immune interfaces and disease-associated tissue regions.

Specifications

Sample Requirements

The quantities listed are provided for reference only. Please download the Sample Requirements for detailed guidance, or Contact us to discuss your project-specific requirements.

Sample Type (Human/Mouse)Minimum amountRNA QCOther details
FFPE *block1 FFPE block
Block thickness > 1mm
DV200 ≥ 30%For optimal capture
area usage:
Multiple tissue pieces can
be embedded into FFPE
or OCT blocks
2 FFPE tissue sections can
be placed on 1 glass slide,
without overlap
FFPE* slide2-4 tissue sections on glass
slides
and
RNA scrolls
(Thickness > 50 µm)
DV200 ≥ 30%For optimal capture
area usage:
Multiple tissue pieces can
be embedded into FFPE
or OCT blocks
2 FFPE tissue sections can
be placed on 1 glass slide,
without overlap
Fresh (frozen)
tisssues
(Embedded in
OCT blocks)
1 OCT block
Block thickness > 1mm
RIN ≥ 4For optimal capture
area usage:
Multiple tissue pieces can
be embedded into FFPE
or OCT blocks
2 FFPE tissue sections can
be placed on 1 glass slide,
without overlap
Species type - Human/Mouse
*FFPE glass slides must be positive charged glass slides.

Sample Requirements

The quantities listed are provided for reference only. Please download the Sample Requirements for detailed guidance, or Contact us to discuss your project-specific requirements.

Sample Type (Human/Mouse)Minimum amountRNA QCOther details
FFPE *block1 FFPE block
Block thickness > 1mm
DV200 ≥ 30%For optimal capture
area usage:
Multiple tissue pieces can
be embedded into FFPE
or OCT blocks
2 FFPE tissue sections can
be placed on 1 glass slide,
without overlap
FFPE* slide2-4 tissue sections on glass
slides
and
RNA scrolls
(Thickness > 50 µm)
DV200 ≥ 30%For optimal capture
area usage:
Multiple tissue pieces can
be embedded into FFPE
or OCT blocks
2 FFPE tissue sections can
be placed on 1 glass slide,
without overlap
Fresh (frozen)
tisssues
(Embedded in
OCT blocks)
1 OCT block
Block thickness > 1mm
RIN ≥ 4For optimal capture
area usage:
Multiple tissue pieces can
be embedded into FFPE
or OCT blocks
2 FFPE tissue sections can
be placed on 1 glass slide,
without overlap
Species type - Human/Mouse
*FFPE glass slides must be positive charged glass slides.

Sample Requirements

The quantities listed are provided for reference only. Please download the Sample Requirements for detailed guidance, or Contact us to discuss your project-specific requirements.

Sample Type (Human/Mouse)Minimum amountRNA QCOther details
FFPE *block1 FFPE block
Block thickness > 1mm
DV200 ≥ 30%For optimal capture
area usage:
Multiple tissue pieces can
be embedded into FFPE
or OCT blocks
2 FFPE tissue sections can
be placed on 1 glass slide,
without overlap
FFPE* slide2-4 tissue sections on glass
slides
and
RNA scrolls
(Thickness > 50 µm)
DV200 ≥ 30%For optimal capture
area usage:
Multiple tissue pieces can
be embedded into FFPE
or OCT blocks
2 FFPE tissue sections can
be placed on 1 glass slide,
without overlap
Fresh (frozen)
tisssues
(Embedded in
OCT blocks)
1 OCT block
Block thickness > 1mm
RIN ≥ 4For optimal capture
area usage:
Multiple tissue pieces can
be embedded into FFPE
or OCT blocks
2 FFPE tissue sections can
be placed on 1 glass slide,
without overlap
Species type - Human/Mouse
*FFPE glass slides must be positive charged glass slides.

Sample Requirements

The quantities listed are provided for reference only. Please download the Sample Requirements for detailed guidance, or Contact us to discuss your project-specific requirements.

Sample Type (Human/Mouse)Minimum amountRNA QCOther details
FFPE *block1 FFPE block
Block thickness > 1mm
DV200 ≥ 30%For optimal capture
area usage:
Multiple tissue pieces can
be embedded into FFPE
or OCT blocks
2 FFPE tissue sections can
be placed on 1 glass slide,
without overlap
FFPE* slide2-4 tissue sections on glass
slides
and
RNA scrolls
(Thickness > 50 µm)
DV200 ≥ 30%For optimal capture
area usage:
Multiple tissue pieces can
be embedded into FFPE
or OCT blocks
2 FFPE tissue sections can
be placed on 1 glass slide,
without overlap
Fresh (frozen)
tisssues
(Embedded in
OCT blocks)
1 OCT block
Block thickness > 1mm
RIN ≥ 4For optimal capture
area usage:
Multiple tissue pieces can
be embedded into FFPE
or OCT blocks
2 FFPE tissue sections can
be placed on 1 glass slide,
without overlap
Species type - Human/Mouse
*FFPE glass slides must be positive charged glass slides.

Sequencing and Analysis

Recommended data outputs and analysis examples are provided for reference only. For detailed information, please contact us to discuss your project-specific analysis requirements.

Visium HD
SpeciesHuman or Mouse
Capture area6.5mm x 6.5mm
Sequencing platformNovaSeq X plus
Read lengthPE150
Recommended Data Amount100 Gb/sample per capture area for FFPE
AnalysisData QC:
Mapping and Quantification
Dimensionality Reduction, Clustering, and Differential analysis:
Graphclust clustering
K-means clustering
Seurat Analysis:
PCA analysis
Spatial variable gene expression analysis
Clustering and dimensionality reduction analysis
Differential Expression Gene Analysis (DEG):
DEGs clustering heatmap
Spatial distribution of DEGs
Violine plot
t-SNE and UMAP dimensional reduction visualization
Functional Enrichment Analysis:
GO enrichment
KEGG enrichment
Reactome enrichment

Sequencing and Analysis

Recommended data outputs and analysis examples are provided for reference only. For detailed information, please contact us to discuss your project-specific analysis requirements.

Visium HD
SpeciesHuman or Mouse
Capture area6.5mm x 6.5mm
Sequencing platformNovaSeq X plus
Read lengthPE150
Recommended Data Amount100 Gb/sample per capture area for FFPE
AnalysisData QC:
Mapping and Quantification
Dimensionality Reduction, Clustering, and Differential analysis:
Graphclust clustering
K-means clustering
Seurat Analysis:
PCA analysis
Spatial variable gene expression analysis
Clustering and dimensionality reduction analysis
Differential Expression Gene Analysis (DEG):
DEGs clustering heatmap
Spatial distribution of DEGs
Violine plot
t-SNE and UMAP dimensional reduction visualization
Functional Enrichment Analysis:
GO enrichment
KEGG enrichment
Reactome enrichment

Sequencing and Analysis

Recommended data outputs and analysis examples are provided for reference only. For detailed information, please contact us to discuss your project-specific analysis requirements.

Visium HD
SpeciesHuman or Mouse
Capture area6.5mm x 6.5mm
Sequencing platformNovaSeq X plus
Read lengthPE150
Recommended Data Amount100 Gb/sample per capture area for FFPE
AnalysisData QC:
Mapping and Quantification
Dimensionality Reduction, Clustering, and Differential analysis:
Graphclust clustering
K-means clustering
Seurat Analysis:
PCA analysis
Spatial variable gene expression analysis
Clustering and dimensionality reduction analysis
Differential Expression Gene Analysis (DEG):
DEGs clustering heatmap
Spatial distribution of DEGs
Violine plot
t-SNE and UMAP dimensional reduction visualization
Functional Enrichment Analysis:
GO enrichment
KEGG enrichment
Reactome enrichment

Sequencing and Analysis

Recommended data outputs and analysis examples are provided for reference only. For detailed information, please contact us to discuss your project-specific analysis requirements.

Visium HD
SpeciesHuman or Mouse
Capture area6.5mm x 6.5mm
Sequencing platformNovaSeq X plus
Read lengthPE150
Recommended Data Amount100 Gb/sample per capture area for FFPE
AnalysisData QC:
Mapping and Quantification
Dimensionality Reduction, Clustering, and Differential analysis:
Graphclust clustering
K-means clustering
Seurat Analysis:
PCA analysis
Spatial variable gene expression analysis
Clustering and dimensionality reduction analysis
Differential Expression Gene Analysis (DEG):
DEGs clustering heatmap
Spatial distribution of DEGs
Violine plot
t-SNE and UMAP dimensional reduction visualization
Functional Enrichment Analysis:
GO enrichment
KEGG enrichment
Reactome enrichment

Specifications

Sample Requirements

The quantities listed are provided for reference only. Please download the Sample Requirements for detailed guidance, or Contact us to discuss your project-specific requirements.

Sample Type (Human/Mouse)Minimum amountRNA QCOther details
FFPE *block1 FFPE block
Block thickness > 1mm
DV200 ≥ 30%For optimal capture
area usage:
Multiple tissue pieces can
be embedded into FFPE
or OCT blocks
2 FFPE tissue sections can
be placed on 1 glass slide,
without overlap
FFPE* slide2-4 tissue sections on glass
slides
and
RNA scrolls
(Thickness > 50 µm)
DV200 ≥ 30%For optimal capture
area usage:
Multiple tissue pieces can
be embedded into FFPE
or OCT blocks
2 FFPE tissue sections can
be placed on 1 glass slide,
without overlap
Fresh (frozen)
tisssues
(Embedded in
OCT blocks)
1 OCT block
Block thickness > 1mm
RIN ≥ 4For optimal capture
area usage:
Multiple tissue pieces can
be embedded into FFPE
or OCT blocks
2 FFPE tissue sections can
be placed on 1 glass slide,
without overlap
Species type - Human/Mouse
*FFPE glass slides must be positive charged glass slides.

Sample Requirements

The quantities listed are provided for reference only. Please download the Sample Requirements for detailed guidance, or Contact us to discuss your project-specific requirements.

Sample Type (Human/Mouse)Minimum amountRNA QCOther details
FFPE *block1 FFPE block
Block thickness > 1mm
DV200 ≥ 30%For optimal capture
area usage:
Multiple tissue pieces can
be embedded into FFPE
or OCT blocks
2 FFPE tissue sections can
be placed on 1 glass slide,
without overlap
FFPE* slide2-4 tissue sections on glass
slides
and
RNA scrolls
(Thickness > 50 µm)
DV200 ≥ 30%For optimal capture
area usage:
Multiple tissue pieces can
be embedded into FFPE
or OCT blocks
2 FFPE tissue sections can
be placed on 1 glass slide,
without overlap
Fresh (frozen)
tisssues
(Embedded in
OCT blocks)
1 OCT block
Block thickness > 1mm
RIN ≥ 4For optimal capture
area usage:
Multiple tissue pieces can
be embedded into FFPE
or OCT blocks
2 FFPE tissue sections can
be placed on 1 glass slide,
without overlap
Species type - Human/Mouse
*FFPE glass slides must be positive charged glass slides.

Sample Requirements

The quantities listed are provided for reference only. Please download the Sample Requirements for detailed guidance, or Contact us to discuss your project-specific requirements.

Sample Type (Human/Mouse)Minimum amountRNA QCOther details
FFPE *block1 FFPE block
Block thickness > 1mm
DV200 ≥ 30%For optimal capture
area usage:
Multiple tissue pieces can
be embedded into FFPE
or OCT blocks
2 FFPE tissue sections can
be placed on 1 glass slide,
without overlap
FFPE* slide2-4 tissue sections on glass
slides
and
RNA scrolls
(Thickness > 50 µm)
DV200 ≥ 30%For optimal capture
area usage:
Multiple tissue pieces can
be embedded into FFPE
or OCT blocks
2 FFPE tissue sections can
be placed on 1 glass slide,
without overlap
Fresh (frozen)
tisssues
(Embedded in
OCT blocks)
1 OCT block
Block thickness > 1mm
RIN ≥ 4For optimal capture
area usage:
Multiple tissue pieces can
be embedded into FFPE
or OCT blocks
2 FFPE tissue sections can
be placed on 1 glass slide,
without overlap
Species type - Human/Mouse
*FFPE glass slides must be positive charged glass slides.

Sample Requirements

The quantities listed are provided for reference only. Please download the Sample Requirements for detailed guidance, or Contact us to discuss your project-specific requirements.

Sample Type (Human/Mouse)Minimum amountRNA QCOther details
FFPE *block1 FFPE block
Block thickness > 1mm
DV200 ≥ 30%For optimal capture
area usage:
Multiple tissue pieces can
be embedded into FFPE
or OCT blocks
2 FFPE tissue sections can
be placed on 1 glass slide,
without overlap
FFPE* slide2-4 tissue sections on glass
slides
and
RNA scrolls
(Thickness > 50 µm)
DV200 ≥ 30%For optimal capture
area usage:
Multiple tissue pieces can
be embedded into FFPE
or OCT blocks
2 FFPE tissue sections can
be placed on 1 glass slide,
without overlap
Fresh (frozen)
tisssues
(Embedded in
OCT blocks)
1 OCT block
Block thickness > 1mm
RIN ≥ 4For optimal capture
area usage:
Multiple tissue pieces can
be embedded into FFPE
or OCT blocks
2 FFPE tissue sections can
be placed on 1 glass slide,
without overlap
Species type - Human/Mouse
*FFPE glass slides must be positive charged glass slides.

Sequencing and Analysis

Recommended data outputs and analysis examples are provided for reference only. For detailed information, please contact us to discuss your project-specific analysis requirements.

Visium HD
SpeciesHuman or Mouse
Capture area6.5mm x 6.5mm
Sequencing platformNovaSeq X plus
Read lengthPE150
Recommended Data Amount100 Gb/sample per capture area for FFPE
AnalysisData QC:
Mapping and Quantification
Dimensionality Reduction, Clustering, and Differential analysis:
Graphclust clustering
K-means clustering
Seurat Analysis:
PCA analysis
Spatial variable gene expression analysis
Clustering and dimensionality reduction analysis
Differential Expression Gene Analysis (DEG):
DEGs clustering heatmap
Spatial distribution of DEGs
Violine plot
t-SNE and UMAP dimensional reduction visualization
Functional Enrichment Analysis:
GO enrichment
KEGG enrichment
Reactome enrichment

Sequencing and Analysis

Recommended data outputs and analysis examples are provided for reference only. For detailed information, please contact us to discuss your project-specific analysis requirements.

Visium HD
SpeciesHuman or Mouse
Capture area6.5mm x 6.5mm
Sequencing platformNovaSeq X plus
Read lengthPE150
Recommended Data Amount100 Gb/sample per capture area for FFPE
AnalysisData QC:
Mapping and Quantification
Dimensionality Reduction, Clustering, and Differential analysis:
Graphclust clustering
K-means clustering
Seurat Analysis:
PCA analysis
Spatial variable gene expression analysis
Clustering and dimensionality reduction analysis
Differential Expression Gene Analysis (DEG):
DEGs clustering heatmap
Spatial distribution of DEGs
Violine plot
t-SNE and UMAP dimensional reduction visualization
Functional Enrichment Analysis:
GO enrichment
KEGG enrichment
Reactome enrichment

Sequencing and Analysis

Recommended data outputs and analysis examples are provided for reference only. For detailed information, please contact us to discuss your project-specific analysis requirements.

Visium HD
SpeciesHuman or Mouse
Capture area6.5mm x 6.5mm
Sequencing platformNovaSeq X plus
Read lengthPE150
Recommended Data Amount100 Gb/sample per capture area for FFPE
AnalysisData QC:
Mapping and Quantification
Dimensionality Reduction, Clustering, and Differential analysis:
Graphclust clustering
K-means clustering
Seurat Analysis:
PCA analysis
Spatial variable gene expression analysis
Clustering and dimensionality reduction analysis
Differential Expression Gene Analysis (DEG):
DEGs clustering heatmap
Spatial distribution of DEGs
Violine plot
t-SNE and UMAP dimensional reduction visualization
Functional Enrichment Analysis:
GO enrichment
KEGG enrichment
Reactome enrichment

Sequencing and Analysis

Recommended data outputs and analysis examples are provided for reference only. For detailed information, please contact us to discuss your project-specific analysis requirements.

Visium HD
SpeciesHuman or Mouse
Capture area6.5mm x 6.5mm
Sequencing platformNovaSeq X plus
Read lengthPE150
Recommended Data Amount100 Gb/sample per capture area for FFPE
AnalysisData QC:
Mapping and Quantification
Dimensionality Reduction, Clustering, and Differential analysis:
Graphclust clustering
K-means clustering
Seurat Analysis:
PCA analysis
Spatial variable gene expression analysis
Clustering and dimensionality reduction analysis
Differential Expression Gene Analysis (DEG):
DEGs clustering heatmap
Spatial distribution of DEGs
Violine plot
t-SNE and UMAP dimensional reduction visualization
Functional Enrichment Analysis:
GO enrichment
KEGG enrichment
Reactome enrichment

Resources

Example Analysis Output

Image
Image
1/1
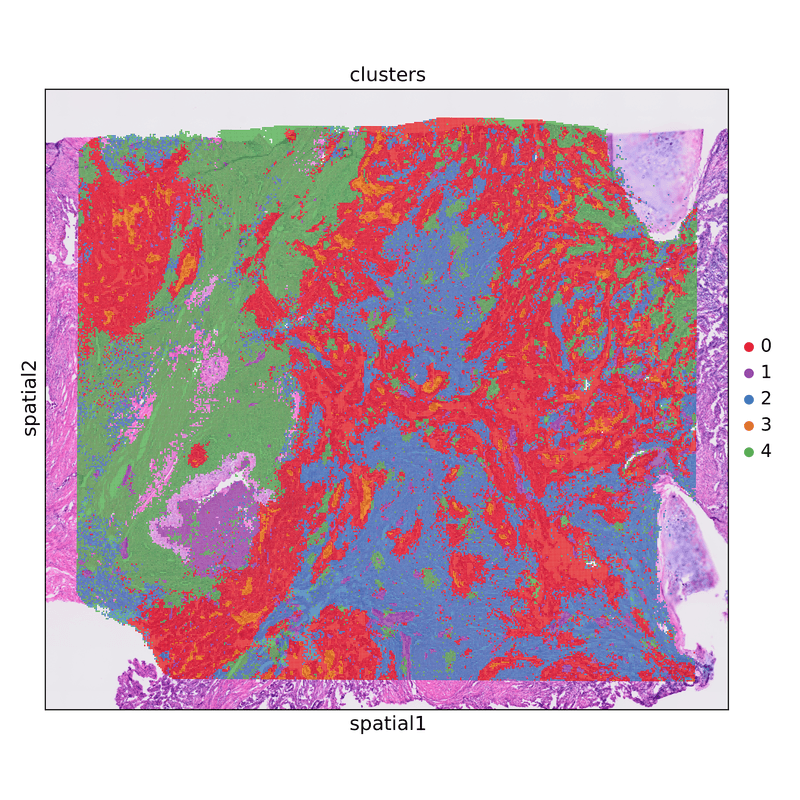
Cluster Map

Visualise spatially defined clusters across the tissue section to explore regional organisation and tissue structure.

Image
Image
1/1
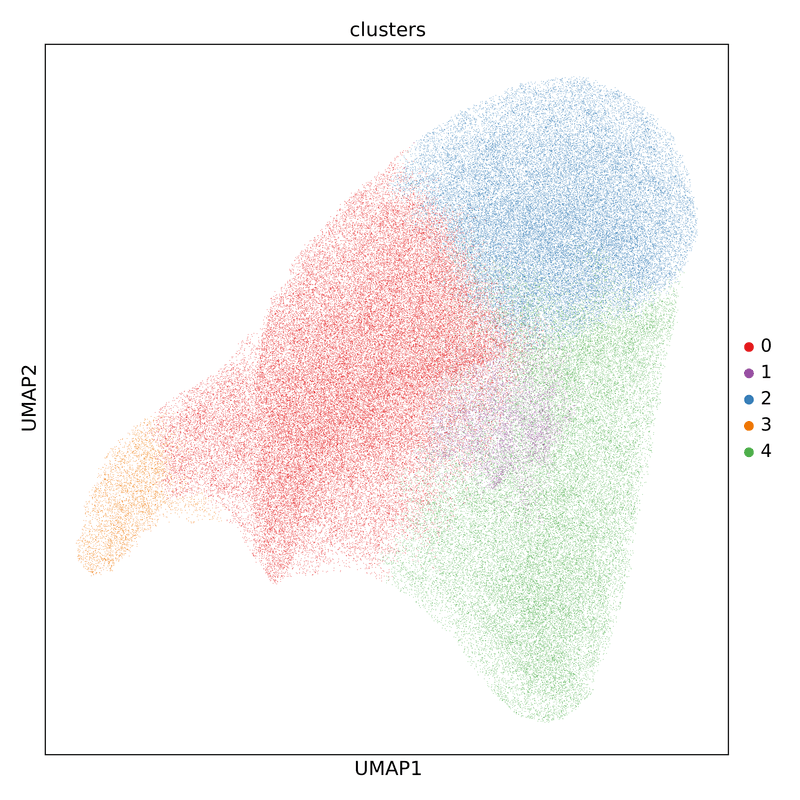
UMAP Clustering

Review transcriptional similarity between spots or bins to support cluster interpretation and data exploration.

Image
Image
1/1
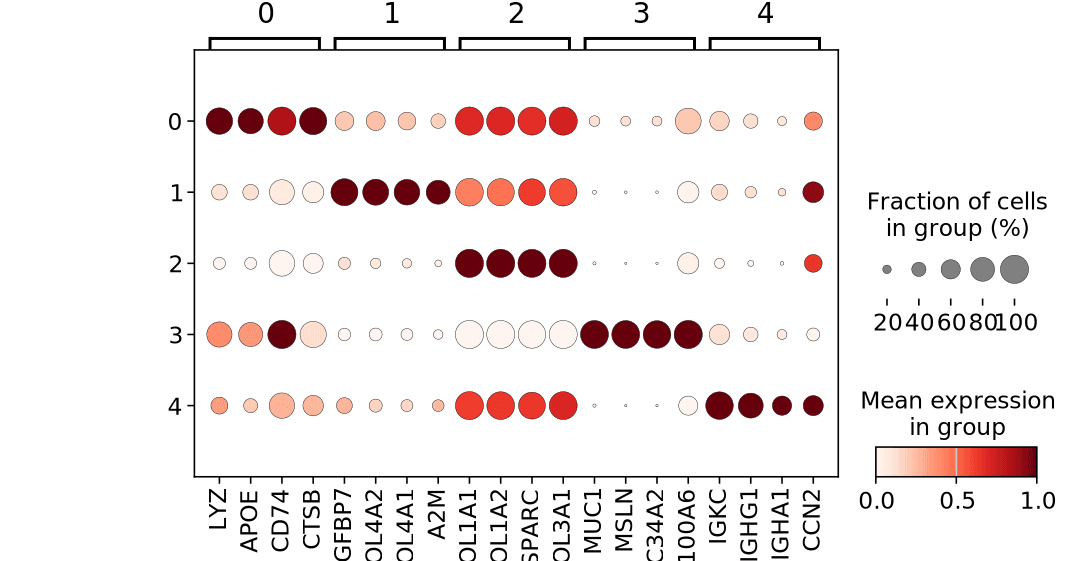
Marker Gene Dot Plot

Compare marker gene expression across clusters to support annotation of tissue regions and cell-associated patterns.

Image
Image
1/1
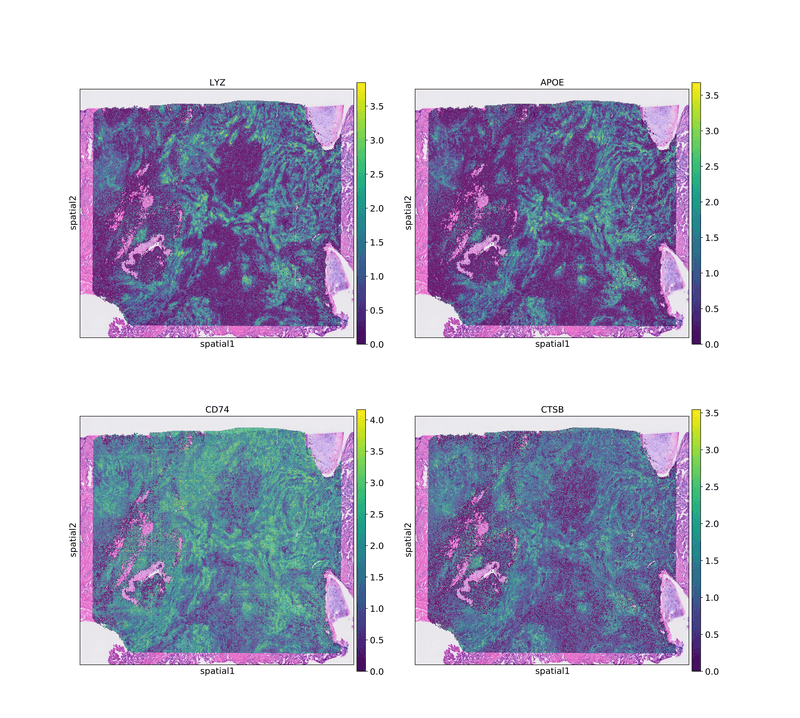
Spatial Gene Expression

Display selected marker genes directly on tissue sections to explore localised expression patterns.

Image
Image
1/1
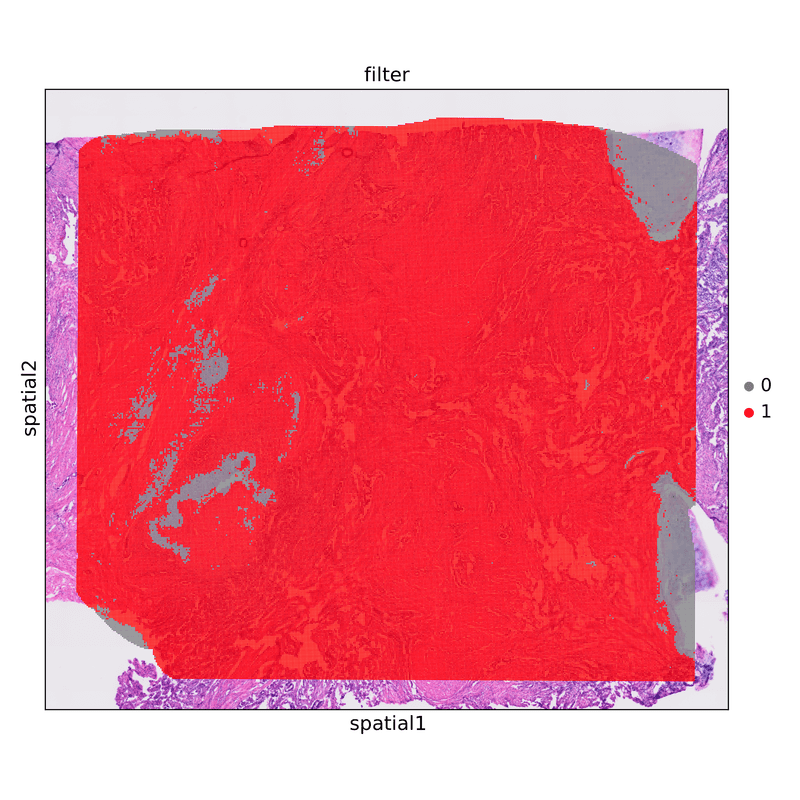
Tissue Filtering

Review tissue-covered areas used for downstream spatial analysis and quality assessment.

Image
Image
1/1
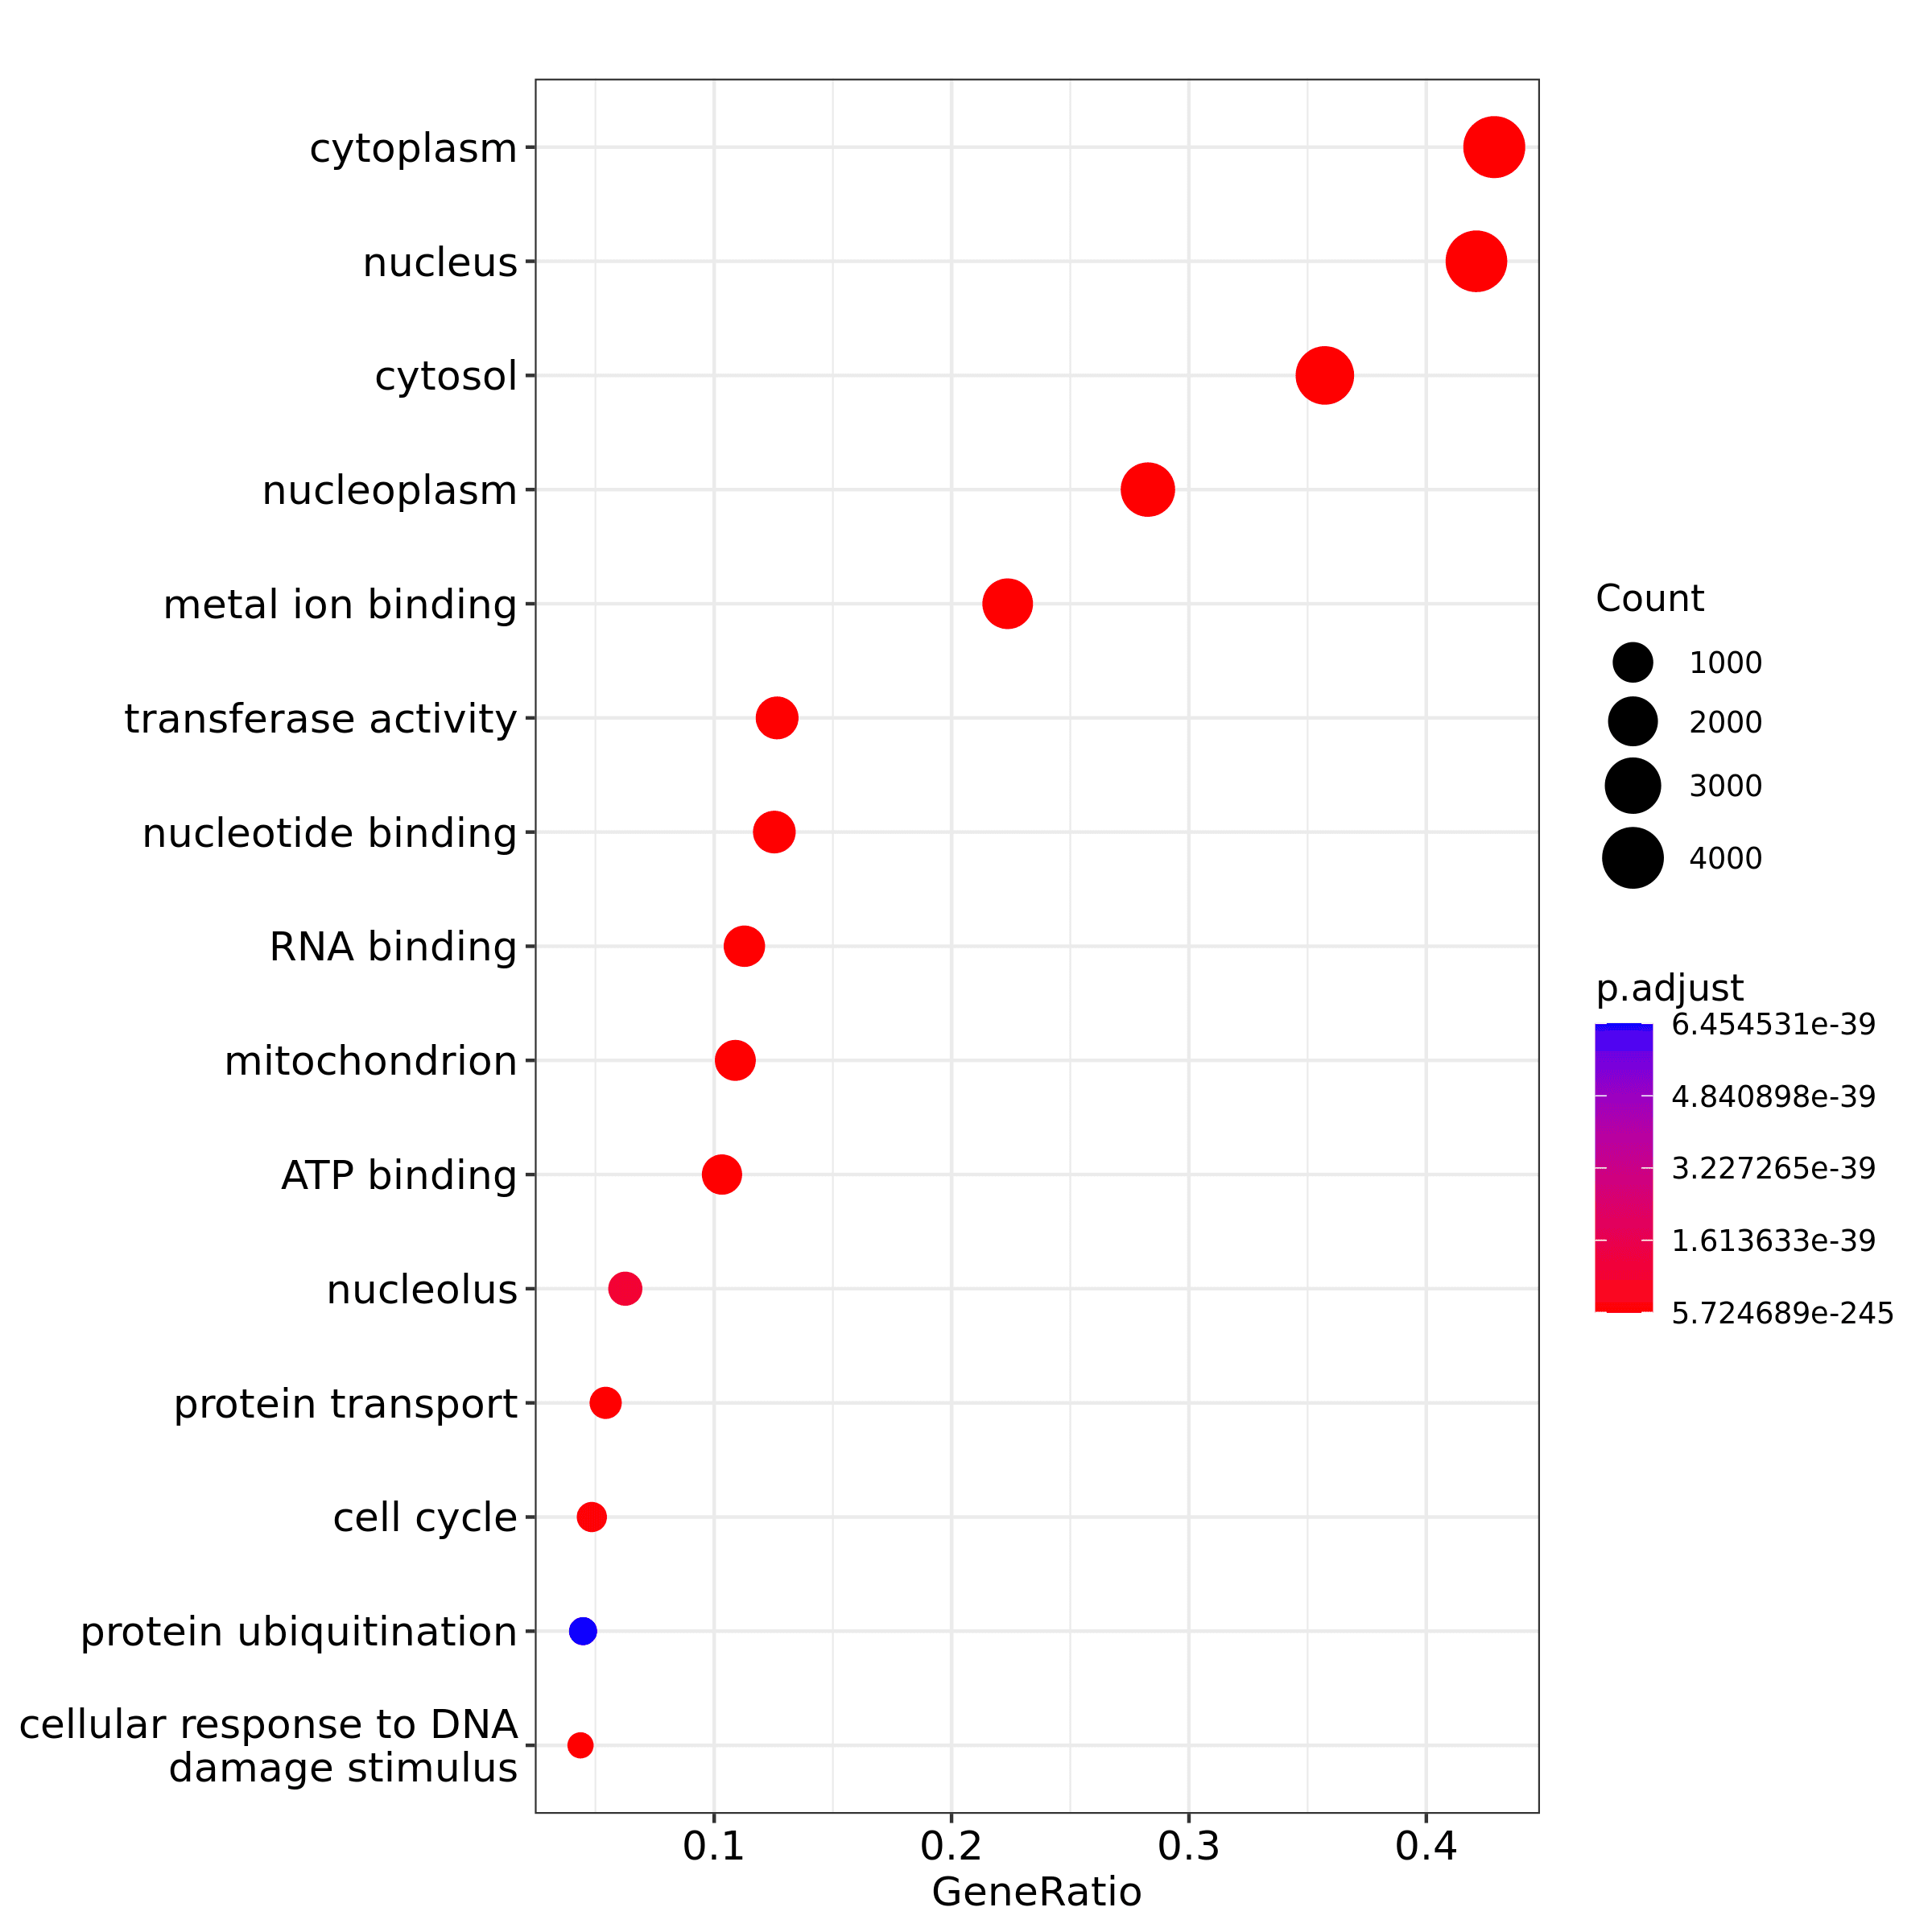
GO Enrichment

Identify enriched biological processes linked to cluster marker genes or region-specific expression patterns.

Image
Image
1/1
Cluster Map

Visualise spatially defined clusters across the tissue section to explore regional organisation and tissue structure.

Image
Image
1/1
UMAP Clustering

Review transcriptional similarity between spots or bins to support cluster interpretation and data exploration.

Image
Image
1/1
Marker Gene Dot Plot

Compare marker gene expression across clusters to support annotation of tissue regions and cell-associated patterns.

Image
Image
1/1
Spatial Gene Expression

Display selected marker genes directly on tissue sections to explore localised expression patterns.

Image
Image
1/1
Tissue Filtering

Review tissue-covered areas used for downstream spatial analysis and quality assessment.

Image
Image
1/1
GO Enrichment

Identify enriched biological processes linked to cluster marker genes or region-specific expression patterns.

Resources

Example Analysis Output

Image
Image
1/1
Cluster Map

Visualise spatially defined clusters across the tissue section to explore regional organisation and tissue structure.

Image
Image
1/1
UMAP Clustering

Review transcriptional similarity between spots or bins to support cluster interpretation and data exploration.

Image
Image
1/1
Marker Gene Dot Plot

Compare marker gene expression across clusters to support annotation of tissue regions and cell-associated patterns.

Image
Image
1/1
Spatial Gene Expression

Display selected marker genes directly on tissue sections to explore localised expression patterns.

Image
Image
1/1
Tissue Filtering

Review tissue-covered areas used for downstream spatial analysis and quality assessment.

Image
Image
1/1
GO Enrichment

Identify enriched biological processes linked to cluster marker genes or region-specific expression patterns.

Image
Image
1/1
Cluster Map

Visualise spatially defined clusters across the tissue section to explore regional organisation and tissue structure.

Image
Image
1/1
UMAP Clustering

Review transcriptional similarity between spots or bins to support cluster interpretation and data exploration.

Image
Image
1/1
Marker Gene Dot Plot

Compare marker gene expression across clusters to support annotation of tissue regions and cell-associated patterns.

Image
Image
1/1
Spatial Gene Expression

Display selected marker genes directly on tissue sections to explore localised expression patterns.

Image
Image
1/1
Tissue Filtering

Review tissue-covered areas used for downstream spatial analysis and quality assessment.

Image
Image
1/1
GO Enrichment

Identify enriched biological processes linked to cluster marker genes or region-specific expression patterns.

Webinars

Getting Started with Spatial Transcriptomics

Looking to get started with spatial transcriptomics? Join this webinar to learn the fundamentals of 10x Genomics Visium HD technology, key applications, sample preparation requirements, and strategies for extracting biological insights from spatial gene expression data.

Learn More
(Getting Started with Spatial Transcriptomics)
Getting Started with Spatial Transcriptomics

Looking to get started with spatial transcriptomics? Join this webinar to learn the fundamentals of 10x Genomics Visium HD technology, key applications, sample preparation requirements, and strategies for extracting biological insights from spatial gene expression data.

Learn More
(Getting Started with Spatial Transcriptomics)
Getting Started with Spatial Transcriptomics

Looking to get started with spatial transcriptomics? Join this webinar to learn the fundamentals of 10x Genomics Visium HD technology, key applications, sample preparation requirements, and strategies for extracting biological insights from spatial gene expression data.

Learn More
(Getting Started with Spatial Transcriptomics)
Getting Started with Spatial Transcriptomics

Looking to get started with spatial transcriptomics? Join this webinar to learn the fundamentals of 10x Genomics Visium HD technology, key applications, sample preparation requirements, and strategies for extracting biological insights from spatial gene expression data.

Learn More
(Getting Started with Spatial Transcriptomics)

Explore Single-cell & Spatial Resources

Access webinars, brochures and case studies covering sequencing technologies, study planning and data interpretation.
View Webinar Library
(Explore Single-cell & Spatial Resources)
View Webinar Library
(Explore Single-cell & Spatial Resources)
Background
Background

Speak with a Specialist

Have a project in mind?


Send us your enquiry and a Novogene Europe specialist will be in touch.


Privacy PolicyCookie PolicyTerms
banner laptop bg
banner mobile bg

Spatial Gene Expression

High-resolution spatial transcriptomics for mapping whole-transcriptome gene expression within tissue architecture, morphology and spatial biological context.
OverviewOverview
BenefitsBenefits
ApplicationsApplications
SpecificationsSpecifications

Spatial gene expression analysis enables researchers to explore where genes are expressed within tissue, helping connect transcriptomic profiles with tissue morphology and spatial organisation. This approach can support studies of complex tissues, cellular neighbourhoods and region-specific biological patterns that may be missed by dissociated single-cell or bulk RNA-seq methods.


Novogene Europe provides Visium HD spatial gene expression services using 10x Genomics CytAssist-enabled workflows. The service supports high-resolution, whole-transcriptome spatial profiling for compatible human and mouse tissue samples, including FFPE and fresh frozen tissue, with downstream analysis to visualise gene expression patterns within tissue context.

Service Highlights

Visium HD Spatial Profiling

High-resolution whole-transcriptome spatial gene expression analysis to explore gene activity within tissue architecture and spatial biological context.

Visium HD Spatial Profiling

High-resolution whole-transcriptome spatial gene expression analysis to explore gene activity within tissue architecture and spatial biological context.

FFPE and Fresh Frozen Support

Workflow options for compatible human and mouse FFPE or fresh frozen tissue samples, depending on tissue quality and project requirements.

FFPE and Fresh Frozen Support

Workflow options for compatible human and mouse FFPE or fresh frozen tissue samples, depending on tissue quality and project requirements.

CytAssist-enabled Workflow

10x Genomics CytAssist technology supports probe transfer from tissue slides to Visium slides, helping preserve spatial information during library preparation.

CytAssist-enabled Workflow

10x Genomics CytAssist technology supports probe transfer from tissue slides to Visium slides, helping preserve spatial information during library preparation.

Spatial Bioinformatics Analysis

Analysis outputs can include data QC, mapping, clustering, spatial gene expression visualisation, differential expression and functional enrichment analysis.

Spatial Bioinformatics Analysis

Analysis outputs can include data QC, mapping, clustering, spatial gene expression visualisation, differential expression and functional enrichment analysis.

Service Highlights

Visium HD Spatial Profiling

High-resolution whole-transcriptome spatial gene expression analysis to explore gene activity within tissue architecture and spatial biological context.

Visium HD Spatial Profiling

High-resolution whole-transcriptome spatial gene expression analysis to explore gene activity within tissue architecture and spatial biological context.

FFPE and Fresh Frozen Support

Workflow options for compatible human and mouse FFPE or fresh frozen tissue samples, depending on tissue quality and project requirements.

FFPE and Fresh Frozen Support

Workflow options for compatible human and mouse FFPE or fresh frozen tissue samples, depending on tissue quality and project requirements.

CytAssist-enabled Workflow

10x Genomics CytAssist technology supports probe transfer from tissue slides to Visium slides, helping preserve spatial information during library preparation.

CytAssist-enabled Workflow

10x Genomics CytAssist technology supports probe transfer from tissue slides to Visium slides, helping preserve spatial information during library preparation.

Spatial Bioinformatics Analysis

Analysis outputs can include data QC, mapping, clustering, spatial gene expression visualisation, differential expression and functional enrichment analysis.

Spatial Bioinformatics Analysis

Analysis outputs can include data QC, mapping, clustering, spatial gene expression visualisation, differential expression and functional enrichment analysis.

Applications

Tissue Architecture Mapping

Profile spatial relationships between tumour, immune and stromal regions to investigate cancer tissue heterogeneity, immune contexture and disease-associated gene expression.

Tissue Architecture Mapping

Profile spatial relationships between tumour, immune and stromal regions to investigate cancer tissue heterogeneity, immune contexture and disease-associated gene expression.

Tumour Microenvironment Studies

Profile spatial relationships between tumour, immune and stromal regions to investigate cancer tissue heterogeneity, immune contexture and disease-associated gene expression.

Tumour Microenvironment Studies

Profile spatial relationships between tumour, immune and stromal regions to investigate cancer tissue heterogeneity, immune contexture and disease-associated gene expression.

Development and Disease Models

Study spatial gene expression changes across developmental stages, neurological models, inflammatory disease models or treatment conditions.

Development and Disease Models

Study spatial gene expression changes across developmental stages, neurological models, inflammatory disease models or treatment conditions.

Cell Neighbourhood Analysis

Investigate localised gene expression patterns and cellular neighbourhoods, including tumour-immune interfaces and disease-associated tissue regions.

Cell Neighbourhood Analysis

Investigate localised gene expression patterns and cellular neighbourhoods, including tumour-immune interfaces and disease-associated tissue regions.

Applications

Tissue Architecture Mapping

Profile spatial relationships between tumour, immune and stromal regions to investigate cancer tissue heterogeneity, immune contexture and disease-associated gene expression.

Tissue Architecture Mapping

Profile spatial relationships between tumour, immune and stromal regions to investigate cancer tissue heterogeneity, immune contexture and disease-associated gene expression.

Tumour Microenvironment Studies

Profile spatial relationships between tumour, immune and stromal regions to investigate cancer tissue heterogeneity, immune contexture and disease-associated gene expression.

Tumour Microenvironment Studies

Profile spatial relationships between tumour, immune and stromal regions to investigate cancer tissue heterogeneity, immune contexture and disease-associated gene expression.

Development and Disease Models

Study spatial gene expression changes across developmental stages, neurological models, inflammatory disease models or treatment conditions.

Development and Disease Models

Study spatial gene expression changes across developmental stages, neurological models, inflammatory disease models or treatment conditions.

Cell Neighbourhood Analysis

Investigate localised gene expression patterns and cellular neighbourhoods, including tumour-immune interfaces and disease-associated tissue regions.

Cell Neighbourhood Analysis

Investigate localised gene expression patterns and cellular neighbourhoods, including tumour-immune interfaces and disease-associated tissue regions.

Specifications

Sample Requirements

The quantities listed are provided for reference only. Please download the Sample Requirements for detailed guidance, or Contact us to discuss your project-specific requirements.

Sample Type (Human/Mouse)Minimum amountRNA QCOther details
FFPE *block1 FFPE block
Block thickness > 1mm
DV200 ≥ 30%For optimal capture
area usage:
Multiple tissue pieces can
be embedded into FFPE
or OCT blocks
2 FFPE tissue sections can
be placed on 1 glass slide,
without overlap
FFPE* slide2-4 tissue sections on glass
slides
and
RNA scrolls
(Thickness > 50 µm)
DV200 ≥ 30%For optimal capture
area usage:
Multiple tissue pieces can
be embedded into FFPE
or OCT blocks
2 FFPE tissue sections can
be placed on 1 glass slide,
without overlap
Fresh (frozen)
tisssues
(Embedded in
OCT blocks)
1 OCT block
Block thickness > 1mm
RIN ≥ 4For optimal capture
area usage:
Multiple tissue pieces can
be embedded into FFPE
or OCT blocks
2 FFPE tissue sections can
be placed on 1 glass slide,
without overlap
Species type - Human/Mouse
*FFPE glass slides must be positive charged glass slides.

Sample Requirements

The quantities listed are provided for reference only. Please download the Sample Requirements for detailed guidance, or Contact us to discuss your project-specific requirements.

Sample Type (Human/Mouse)Minimum amountRNA QCOther details
FFPE *block1 FFPE block
Block thickness > 1mm
DV200 ≥ 30%For optimal capture
area usage:
Multiple tissue pieces can
be embedded into FFPE
or OCT blocks
2 FFPE tissue sections can
be placed on 1 glass slide,
without overlap
FFPE* slide2-4 tissue sections on glass
slides
and
RNA scrolls
(Thickness > 50 µm)
DV200 ≥ 30%For optimal capture
area usage:
Multiple tissue pieces can
be embedded into FFPE
or OCT blocks
2 FFPE tissue sections can
be placed on 1 glass slide,
without overlap
Fresh (frozen)
tisssues
(Embedded in
OCT blocks)
1 OCT block
Block thickness > 1mm
RIN ≥ 4For optimal capture
area usage:
Multiple tissue pieces can
be embedded into FFPE
or OCT blocks
2 FFPE tissue sections can
be placed on 1 glass slide,
without overlap
Species type - Human/Mouse
*FFPE glass slides must be positive charged glass slides.

Sample Requirements

The quantities listed are provided for reference only. Please download the Sample Requirements for detailed guidance, or Contact us to discuss your project-specific requirements.

Sample Type (Human/Mouse)Minimum amountRNA QCOther details
FFPE *block1 FFPE block
Block thickness > 1mm
DV200 ≥ 30%For optimal capture
area usage:
Multiple tissue pieces can
be embedded into FFPE
or OCT blocks
2 FFPE tissue sections can
be placed on 1 glass slide,
without overlap
FFPE* slide2-4 tissue sections on glass
slides
and
RNA scrolls
(Thickness > 50 µm)
DV200 ≥ 30%For optimal capture
area usage:
Multiple tissue pieces can
be embedded into FFPE
or OCT blocks
2 FFPE tissue sections can
be placed on 1 glass slide,
without overlap
Fresh (frozen)
tisssues
(Embedded in
OCT blocks)
1 OCT block
Block thickness > 1mm
RIN ≥ 4For optimal capture
area usage:
Multiple tissue pieces can
be embedded into FFPE
or OCT blocks
2 FFPE tissue sections can
be placed on 1 glass slide,
without overlap
Species type - Human/Mouse
*FFPE glass slides must be positive charged glass slides.

Sample Requirements

The quantities listed are provided for reference only. Please download the Sample Requirements for detailed guidance, or Contact us to discuss your project-specific requirements.

Sample Type (Human/Mouse)Minimum amountRNA QCOther details
FFPE *block1 FFPE block
Block thickness > 1mm
DV200 ≥ 30%For optimal capture
area usage:
Multiple tissue pieces can
be embedded into FFPE
or OCT blocks
2 FFPE tissue sections can
be placed on 1 glass slide,
without overlap
FFPE* slide2-4 tissue sections on glass
slides
and
RNA scrolls
(Thickness > 50 µm)
DV200 ≥ 30%For optimal capture
area usage:
Multiple tissue pieces can
be embedded into FFPE
or OCT blocks
2 FFPE tissue sections can
be placed on 1 glass slide,
without overlap
Fresh (frozen)
tisssues
(Embedded in
OCT blocks)
1 OCT block
Block thickness > 1mm
RIN ≥ 4For optimal capture
area usage:
Multiple tissue pieces can
be embedded into FFPE
or OCT blocks
2 FFPE tissue sections can
be placed on 1 glass slide,
without overlap
Species type - Human/Mouse
*FFPE glass slides must be positive charged glass slides.

Sequencing and Analysis

Recommended data outputs and analysis examples are provided for reference only. For detailed information, please contact us to discuss your project-specific analysis requirements.

Visium HD
SpeciesHuman or Mouse
Capture area6.5mm x 6.5mm
Sequencing platformNovaSeq X plus
Read lengthPE150
Recommended Data Amount100 Gb/sample per capture area for FFPE
AnalysisData QC:
Mapping and Quantification
Dimensionality Reduction, Clustering, and Differential analysis:
Graphclust clustering
K-means clustering
Seurat Analysis:
PCA analysis
Spatial variable gene expression analysis
Clustering and dimensionality reduction analysis
Differential Expression Gene Analysis (DEG):
DEGs clustering heatmap
Spatial distribution of DEGs
Violine plot
t-SNE and UMAP dimensional reduction visualization
Functional Enrichment Analysis:
GO enrichment
KEGG enrichment
Reactome enrichment

Sequencing and Analysis

Recommended data outputs and analysis examples are provided for reference only. For detailed information, please contact us to discuss your project-specific analysis requirements.

Visium HD
SpeciesHuman or Mouse
Capture area6.5mm x 6.5mm
Sequencing platformNovaSeq X plus
Read lengthPE150
Recommended Data Amount100 Gb/sample per capture area for FFPE
AnalysisData QC:
Mapping and Quantification
Dimensionality Reduction, Clustering, and Differential analysis:
Graphclust clustering
K-means clustering
Seurat Analysis:
PCA analysis
Spatial variable gene expression analysis
Clustering and dimensionality reduction analysis
Differential Expression Gene Analysis (DEG):
DEGs clustering heatmap
Spatial distribution of DEGs
Violine plot
t-SNE and UMAP dimensional reduction visualization
Functional Enrichment Analysis:
GO enrichment
KEGG enrichment
Reactome enrichment

Sequencing and Analysis

Recommended data outputs and analysis examples are provided for reference only. For detailed information, please contact us to discuss your project-specific analysis requirements.

Visium HD
SpeciesHuman or Mouse
Capture area6.5mm x 6.5mm
Sequencing platformNovaSeq X plus
Read lengthPE150
Recommended Data Amount100 Gb/sample per capture area for FFPE
AnalysisData QC:
Mapping and Quantification
Dimensionality Reduction, Clustering, and Differential analysis:
Graphclust clustering
K-means clustering
Seurat Analysis:
PCA analysis
Spatial variable gene expression analysis
Clustering and dimensionality reduction analysis
Differential Expression Gene Analysis (DEG):
DEGs clustering heatmap
Spatial distribution of DEGs
Violine plot
t-SNE and UMAP dimensional reduction visualization
Functional Enrichment Analysis:
GO enrichment
KEGG enrichment
Reactome enrichment

Sequencing and Analysis

Recommended data outputs and analysis examples are provided for reference only. For detailed information, please contact us to discuss your project-specific analysis requirements.

Visium HD
SpeciesHuman or Mouse
Capture area6.5mm x 6.5mm
Sequencing platformNovaSeq X plus
Read lengthPE150
Recommended Data Amount100 Gb/sample per capture area for FFPE
AnalysisData QC:
Mapping and Quantification
Dimensionality Reduction, Clustering, and Differential analysis:
Graphclust clustering
K-means clustering
Seurat Analysis:
PCA analysis
Spatial variable gene expression analysis
Clustering and dimensionality reduction analysis
Differential Expression Gene Analysis (DEG):
DEGs clustering heatmap
Spatial distribution of DEGs
Violine plot
t-SNE and UMAP dimensional reduction visualization
Functional Enrichment Analysis:
GO enrichment
KEGG enrichment
Reactome enrichment

Specifications

Sample Requirements

The quantities listed are provided for reference only. Please download the Sample Requirements for detailed guidance, or Contact us to discuss your project-specific requirements.

Sample Type (Human/Mouse)Minimum amountRNA QCOther details
FFPE *block1 FFPE block
Block thickness > 1mm
DV200 ≥ 30%For optimal capture
area usage:
Multiple tissue pieces can
be embedded into FFPE
or OCT blocks
2 FFPE tissue sections can
be placed on 1 glass slide,
without overlap
FFPE* slide2-4 tissue sections on glass
slides
and
RNA scrolls
(Thickness > 50 µm)
DV200 ≥ 30%For optimal capture
area usage:
Multiple tissue pieces can
be embedded into FFPE
or OCT blocks
2 FFPE tissue sections can
be placed on 1 glass slide,
without overlap
Fresh (frozen)
tisssues
(Embedded in
OCT blocks)
1 OCT block
Block thickness > 1mm
RIN ≥ 4For optimal capture
area usage:
Multiple tissue pieces can
be embedded into FFPE
or OCT blocks
2 FFPE tissue sections can
be placed on 1 glass slide,
without overlap
Species type - Human/Mouse
*FFPE glass slides must be positive charged glass slides.

Sample Requirements

The quantities listed are provided for reference only. Please download the Sample Requirements for detailed guidance, or Contact us to discuss your project-specific requirements.

Sample Type (Human/Mouse)Minimum amountRNA QCOther details
FFPE *block1 FFPE block
Block thickness > 1mm
DV200 ≥ 30%For optimal capture
area usage:
Multiple tissue pieces can
be embedded into FFPE
or OCT blocks
2 FFPE tissue sections can
be placed on 1 glass slide,
without overlap
FFPE* slide2-4 tissue sections on glass
slides
and
RNA scrolls
(Thickness > 50 µm)
DV200 ≥ 30%For optimal capture
area usage:
Multiple tissue pieces can
be embedded into FFPE
or OCT blocks
2 FFPE tissue sections can
be placed on 1 glass slide,
without overlap
Fresh (frozen)
tisssues
(Embedded in
OCT blocks)
1 OCT block
Block thickness > 1mm
RIN ≥ 4For optimal capture
area usage:
Multiple tissue pieces can
be embedded into FFPE
or OCT blocks
2 FFPE tissue sections can
be placed on 1 glass slide,
without overlap
Species type - Human/Mouse
*FFPE glass slides must be positive charged glass slides.

Sample Requirements

The quantities listed are provided for reference only. Please download the Sample Requirements for detailed guidance, or Contact us to discuss your project-specific requirements.

Sample Type (Human/Mouse)Minimum amountRNA QCOther details
FFPE *block1 FFPE block
Block thickness > 1mm
DV200 ≥ 30%For optimal capture
area usage:
Multiple tissue pieces can
be embedded into FFPE
or OCT blocks
2 FFPE tissue sections can
be placed on 1 glass slide,
without overlap
FFPE* slide2-4 tissue sections on glass
slides
and
RNA scrolls
(Thickness > 50 µm)
DV200 ≥ 30%For optimal capture
area usage:
Multiple tissue pieces can
be embedded into FFPE
or OCT blocks
2 FFPE tissue sections can
be placed on 1 glass slide,
without overlap
Fresh (frozen)
tisssues
(Embedded in
OCT blocks)
1 OCT block
Block thickness > 1mm
RIN ≥ 4For optimal capture
area usage:
Multiple tissue pieces can
be embedded into FFPE
or OCT blocks
2 FFPE tissue sections can
be placed on 1 glass slide,
without overlap
Species type - Human/Mouse
*FFPE glass slides must be positive charged glass slides.

Sample Requirements

The quantities listed are provided for reference only. Please download the Sample Requirements for detailed guidance, or Contact us to discuss your project-specific requirements.

Sample Type (Human/Mouse)Minimum amountRNA QCOther details
FFPE *block1 FFPE block
Block thickness > 1mm
DV200 ≥ 30%For optimal capture
area usage:
Multiple tissue pieces can
be embedded into FFPE
or OCT blocks
2 FFPE tissue sections can
be placed on 1 glass slide,
without overlap
FFPE* slide2-4 tissue sections on glass
slides
and
RNA scrolls
(Thickness > 50 µm)
DV200 ≥ 30%For optimal capture
area usage:
Multiple tissue pieces can
be embedded into FFPE
or OCT blocks
2 FFPE tissue sections can
be placed on 1 glass slide,
without overlap
Fresh (frozen)
tisssues
(Embedded in
OCT blocks)
1 OCT block
Block thickness > 1mm
RIN ≥ 4For optimal capture
area usage:
Multiple tissue pieces can
be embedded into FFPE
or OCT blocks
2 FFPE tissue sections can
be placed on 1 glass slide,
without overlap
Species type - Human/Mouse
*FFPE glass slides must be positive charged glass slides.

Sequencing and Analysis

Recommended data outputs and analysis examples are provided for reference only. For detailed information, please contact us to discuss your project-specific analysis requirements.

Visium HD
SpeciesHuman or Mouse
Capture area6.5mm x 6.5mm
Sequencing platformNovaSeq X plus
Read lengthPE150
Recommended Data Amount100 Gb/sample per capture area for FFPE
AnalysisData QC:
Mapping and Quantification
Dimensionality Reduction, Clustering, and Differential analysis:
Graphclust clustering
K-means clustering
Seurat Analysis:
PCA analysis
Spatial variable gene expression analysis
Clustering and dimensionality reduction analysis
Differential Expression Gene Analysis (DEG):
DEGs clustering heatmap
Spatial distribution of DEGs
Violine plot
t-SNE and UMAP dimensional reduction visualization
Functional Enrichment Analysis:
GO enrichment
KEGG enrichment
Reactome enrichment

Sequencing and Analysis

Recommended data outputs and analysis examples are provided for reference only. For detailed information, please contact us to discuss your project-specific analysis requirements.

Visium HD
SpeciesHuman or Mouse
Capture area6.5mm x 6.5mm
Sequencing platformNovaSeq X plus
Read lengthPE150
Recommended Data Amount100 Gb/sample per capture area for FFPE
AnalysisData QC:
Mapping and Quantification
Dimensionality Reduction, Clustering, and Differential analysis:
Graphclust clustering
K-means clustering
Seurat Analysis:
PCA analysis
Spatial variable gene expression analysis
Clustering and dimensionality reduction analysis
Differential Expression Gene Analysis (DEG):
DEGs clustering heatmap
Spatial distribution of DEGs
Violine plot
t-SNE and UMAP dimensional reduction visualization
Functional Enrichment Analysis:
GO enrichment
KEGG enrichment
Reactome enrichment

Sequencing and Analysis

Recommended data outputs and analysis examples are provided for reference only. For detailed information, please contact us to discuss your project-specific analysis requirements.

Visium HD
SpeciesHuman or Mouse
Capture area6.5mm x 6.5mm
Sequencing platformNovaSeq X plus
Read lengthPE150
Recommended Data Amount100 Gb/sample per capture area for FFPE
AnalysisData QC:
Mapping and Quantification
Dimensionality Reduction, Clustering, and Differential analysis:
Graphclust clustering
K-means clustering
Seurat Analysis:
PCA analysis
Spatial variable gene expression analysis
Clustering and dimensionality reduction analysis
Differential Expression Gene Analysis (DEG):
DEGs clustering heatmap
Spatial distribution of DEGs
Violine plot
t-SNE and UMAP dimensional reduction visualization
Functional Enrichment Analysis:
GO enrichment
KEGG enrichment
Reactome enrichment

Sequencing and Analysis

Recommended data outputs and analysis examples are provided for reference only. For detailed information, please contact us to discuss your project-specific analysis requirements.

Visium HD
SpeciesHuman or Mouse
Capture area6.5mm x 6.5mm
Sequencing platformNovaSeq X plus
Read lengthPE150
Recommended Data Amount100 Gb/sample per capture area for FFPE
AnalysisData QC:
Mapping and Quantification
Dimensionality Reduction, Clustering, and Differential analysis:
Graphclust clustering
K-means clustering
Seurat Analysis:
PCA analysis
Spatial variable gene expression analysis
Clustering and dimensionality reduction analysis
Differential Expression Gene Analysis (DEG):
DEGs clustering heatmap
Spatial distribution of DEGs
Violine plot
t-SNE and UMAP dimensional reduction visualization
Functional Enrichment Analysis:
GO enrichment
KEGG enrichment
Reactome enrichment

Resources

Example Analysis Output

Image
Image
1/1
Cluster Map

Visualise spatially defined clusters across the tissue section to explore regional organisation and tissue structure.

Image
Image
1/1
UMAP Clustering

Review transcriptional similarity between spots or bins to support cluster interpretation and data exploration.

Image
Image
1/1
Marker Gene Dot Plot

Compare marker gene expression across clusters to support annotation of tissue regions and cell-associated patterns.

Image
Image
1/1
Spatial Gene Expression

Display selected marker genes directly on tissue sections to explore localised expression patterns.

Image
Image
1/1
Tissue Filtering

Review tissue-covered areas used for downstream spatial analysis and quality assessment.

Image
Image
1/1
GO Enrichment

Identify enriched biological processes linked to cluster marker genes or region-specific expression patterns.

Image
Image
1/1
Cluster Map

Visualise spatially defined clusters across the tissue section to explore regional organisation and tissue structure.

Image
Image
1/1
UMAP Clustering

Review transcriptional similarity between spots or bins to support cluster interpretation and data exploration.

Image
Image
1/1
Marker Gene Dot Plot

Compare marker gene expression across clusters to support annotation of tissue regions and cell-associated patterns.

Image
Image
1/1
Spatial Gene Expression

Display selected marker genes directly on tissue sections to explore localised expression patterns.

Image
Image
1/1
Tissue Filtering

Review tissue-covered areas used for downstream spatial analysis and quality assessment.

Image
Image
1/1
GO Enrichment

Identify enriched biological processes linked to cluster marker genes or region-specific expression patterns.

Resources

Example Analysis Output

Image
Image
1/1
Cluster Map

Visualise spatially defined clusters across the tissue section to explore regional organisation and tissue structure.

Image
Image
1/1
UMAP Clustering

Review transcriptional similarity between spots or bins to support cluster interpretation and data exploration.

Image
Image
1/1
Marker Gene Dot Plot

Compare marker gene expression across clusters to support annotation of tissue regions and cell-associated patterns.

Image
Image
1/1
Spatial Gene Expression

Display selected marker genes directly on tissue sections to explore localised expression patterns.

Image
Image
1/1
Tissue Filtering

Review tissue-covered areas used for downstream spatial analysis and quality assessment.

Image
Image
1/1
GO Enrichment

Identify enriched biological processes linked to cluster marker genes or region-specific expression patterns.

Image
Image
1/1
Cluster Map

Visualise spatially defined clusters across the tissue section to explore regional organisation and tissue structure.

Image
Image
1/1
UMAP Clustering

Review transcriptional similarity between spots or bins to support cluster interpretation and data exploration.

Image
Image
1/1
Marker Gene Dot Plot

Compare marker gene expression across clusters to support annotation of tissue regions and cell-associated patterns.

Image
Image
1/1
Spatial Gene Expression

Display selected marker genes directly on tissue sections to explore localised expression patterns.

Image
Image
1/1
Tissue Filtering

Review tissue-covered areas used for downstream spatial analysis and quality assessment.

Image
Image
1/1
GO Enrichment

Identify enriched biological processes linked to cluster marker genes or region-specific expression patterns.

Webinars

Getting Started with Spatial Transcriptomics

Looking to get started with spatial transcriptomics? Join this webinar to learn the fundamentals of 10x Genomics Visium HD technology, key applications, sample preparation requirements, and strategies for extracting biological insights from spatial gene expression data.

Learn More
(Getting Started with Spatial Transcriptomics)
Getting Started with Spatial Transcriptomics

Looking to get started with spatial transcriptomics? Join this webinar to learn the fundamentals of 10x Genomics Visium HD technology, key applications, sample preparation requirements, and strategies for extracting biological insights from spatial gene expression data.

Learn More
(Getting Started with Spatial Transcriptomics)
Getting Started with Spatial Transcriptomics

Looking to get started with spatial transcriptomics? Join this webinar to learn the fundamentals of 10x Genomics Visium HD technology, key applications, sample preparation requirements, and strategies for extracting biological insights from spatial gene expression data.

Learn More
(Getting Started with Spatial Transcriptomics)
Getting Started with Spatial Transcriptomics

Looking to get started with spatial transcriptomics? Join this webinar to learn the fundamentals of 10x Genomics Visium HD technology, key applications, sample preparation requirements, and strategies for extracting biological insights from spatial gene expression data.

Learn More
(Getting Started with Spatial Transcriptomics)

Explore Single-cell & Spatial Resources

Access webinars, brochures and case studies covering sequencing technologies, study planning and data interpretation.
View Webinar Library
(Explore Single-cell & Spatial Resources)
View Webinar Library
(Explore Single-cell & Spatial Resources)
Background
Background

Speak with a Specialist

Have a project in mind?


Send us your enquiry and a Novogene Europe specialist will be in touch.


Privacy PolicyCookie PolicyTerms