
• Cart
    • Quote
    • Enquiry
    • Cart
    • Quote
    • Enquiry
Novogene Europe
  • Novogene Europe
  • Genomics
    • Human Whole Genome Sequencing
    • Whole Exome Sequencing
    • Plant and Animal Whole Genome Sequencing
    • Plant and Animal De novo Sequencing
    • Microbial Whole Genome Sequencing
    • Microbial De novo Sequencing
    • Whole Plasmid SequencingOrder Online!
    Proteomics
    • Olink ProteomicsNew!
    Epigenomics
    • DNA Methylation SequencingUpdated!
    • Chromatin Immunoprecipitation Sequencing (ChIP-seq)
    • RNA Immunoprecipitation Sequencing (RIP-seq)
    Metabolomics
    • Untargeted MetabolomicsComing Soon!
    Transcriptomics
    • mRNA Sequencing
    • Small RNA Sequencing (sRNA‑seq)
    • Circular RNA Sequencing (circRNA-seq)
    • Total RNA Sequencing
    • Whole Transcriptome Sequencing
    • Full-Length Transcriptome Sequencing
    • Prokaryotic RNA Sequencing
    • Metatranscriptome Sequencing
    Metagenomics
    • Amplicon SequencingOrder Online!
    • Shotgun Metagenomics Sequencing
    Single Cell & Spatial Omics
    • 10X Single Cell Gene Expression
    • 10X Single Cell Immune Profiling
    • 10X Visium HD Spatial Gene Expression
    Premade Library
    • Sequencing Only on Illumina® Sequencer
    • Sequencing Only on Element SequencerNew!
    • Sequencing Only on PacBio Sequencer
    Translational Research
    • Accredited & Validated Clinical Research Sequencing
  • PromotionsPromotions
    • Platforms
    • Automated Delivery Platform (Falcon)
    • Bioinformatics Analysis Tool (NovoMagic)
    • Customer Service System (CSS)
    • Customer Support
    • Webinars
    • Case Study
    • Blog
    • Brochure
    • Cancer Research
    • Immuno-oncology
    • Agrigenomics
    • Environment
    • Food Science
    • Human Microbiome
    • Plant and Animal Microbiome
    • Drug Discovery and Development
    • Rare and Complex Diseases
    • About Us
    • News & Events
    • Careers
    • Our Locations
  • Contact UsContact Us
    • Amplicon Sequencing
    • Whole Plasmid Sequencing

ServicesServices menu

ResourcesResources menu

SupportSupport menu

CompanyCompany menu

Services
Human Whole Genome SequencingWhole Exome SequencingPlant and Animal Whole Genome SequencingPlant and Animal De novo SequencingDNA Methylation SequencingmRNA SequencingFull-Length Transcriptome SequencingWhole Transcriptome SequencingMetatranscriptome SequencingShotgun Metagenomics SequencingAmplicon SequencingWhole Plasmid Sequencing10X Single Cell Gene Expression10X Single Cell Immune Profiling10X Visium HD Spatial Gene ExpressionOlink ProteomicsUntargeted MetabolomicsAccredited & Validated Clinical Research Sequencing
Resources
WebinarsCase StudyBlogBrochure
Support
PlatformBioinformatics Analysis Tool (NovoMagic)Customer Service System (CSS)Customer Support
Company
About UsNews & EventsLocationContact Us
LinkedInLinkedIn hoverYouTubeYouTube hoverInstagramInstagram hoverXX hover
Copyright © 2026 Novogene Inc. All rights reserved.For Research Use Only. Not for Clinical Diagnostic Use.
    • Cart
    • Quote
    • Enquiry
    • Cart
    • Quote
    • Enquiry
Novogene Europe
  • Novogene Europe
  • Genomics
    • Human Whole Genome Sequencing
    • Whole Exome Sequencing
    • Plant and Animal Whole Genome Sequencing
    • Plant and Animal De novo Sequencing
    • Microbial Whole Genome Sequencing
    • Microbial De novo Sequencing
    • Whole Plasmid SequencingOrder Online!
    Proteomics
    • Olink ProteomicsNew!
    Epigenomics
    • DNA Methylation SequencingUpdated!
    • Chromatin Immunoprecipitation Sequencing (ChIP-seq)
    • RNA Immunoprecipitation Sequencing (RIP-seq)
    Metabolomics
    • Untargeted MetabolomicsComing Soon!
    Transcriptomics
    • mRNA Sequencing
    • Small RNA Sequencing (sRNA‑seq)
    • Circular RNA Sequencing (circRNA-seq)
    • Total RNA Sequencing
    • Whole Transcriptome Sequencing
    • Full-Length Transcriptome Sequencing
    • Prokaryotic RNA Sequencing
    • Metatranscriptome Sequencing
    Metagenomics
    • Amplicon SequencingOrder Online!
    • Shotgun Metagenomics Sequencing
    Single Cell & Spatial Omics
    • 10X Single Cell Gene Expression
    • 10X Single Cell Immune Profiling
    • 10X Visium HD Spatial Gene Expression
    Premade Library
    • Sequencing Only on Illumina® Sequencer
    • Sequencing Only on Element SequencerNew!
    • Sequencing Only on PacBio Sequencer
    Translational Research
    • Accredited & Validated Clinical Research Sequencing
  • PromotionsPromotions
    • Platforms
    • Automated Delivery Platform (Falcon)
    • Bioinformatics Analysis Tool (NovoMagic)
    • Customer Service System (CSS)
    • Customer Support
    • Webinars
    • Case Study
    • Blog
    • Brochure
    • Cancer Research
    • Immuno-oncology
    • Agrigenomics
    • Environment
    • Food Science
    • Human Microbiome
    • Plant and Animal Microbiome
    • Drug Discovery and Development
    • Rare and Complex Diseases
    • About Us
    • News & Events
    • Careers
    • Our Locations
  • Contact UsContact Us
    • Amplicon Sequencing
    • Whole Plasmid Sequencing

ServicesServices menu

ResourcesResources menu

SupportSupport menu

CompanyCompany menu

Services
Human Whole Genome SequencingWhole Exome SequencingPlant and Animal Whole Genome SequencingPlant and Animal De novo SequencingDNA Methylation SequencingmRNA SequencingFull-Length Transcriptome SequencingWhole Transcriptome SequencingMetatranscriptome SequencingShotgun Metagenomics SequencingAmplicon SequencingWhole Plasmid Sequencing10X Single Cell Gene Expression10X Single Cell Immune Profiling10X Visium HD Spatial Gene ExpressionOlink ProteomicsUntargeted MetabolomicsAccredited & Validated Clinical Research Sequencing
Resources
WebinarsCase StudyBlogBrochure
Support
PlatformBioinformatics Analysis Tool (NovoMagic)Customer Service System (CSS)Customer Support
Company
About UsNews & EventsLocationContact Us
LinkedInLinkedIn hoverYouTubeYouTube hoverInstagramInstagram hoverXX hover
Copyright © 2026 Novogene Inc. All rights reserved.For Research Use Only. Not for Clinical Diagnostic Use.
banner laptop bg
banner mobile bg

Untargeted Metabolomics

Comprehensive high-resolution small-molecule profiling to reveal global metabolic changes, identify differential metabolites, and support biological discovery.
OverviewOverview
BenefitsBenefits
ApplicationsApplications
SpecificationsSpecifications
ResourcesResources

Untargeted metabolomics provides a broad view of small-molecule changes that sit close to phenotype, helping researchers explore the biochemical activity underlying complex biological systems. Using liquid chromatography–mass spectrometry (LC-MS), this approach supports discovery-led analysis across suitable biological sample types, conditions and experimental groups.


Novogene Europe supports untargeted metabolomics projects through its Cambridge Omics Centre, using high-resolution LC-MS analysis, metabolite annotation and bioinformatics workflows. The service helps researchers investigate differential metabolites, pathway changes, disease mechanisms, microbiome interactions and treatment response, with potential integration alongside other omics data.

Service Highlights

High-resolution LC-MS Workflow

Built around Vanquish™ UHPLC coupled with Orbitrap™ Exploris™ 120 HRAM MS, supporting high-resolution metabolite profiling across suitable sample types.

High-resolution LC-MS Workflow

Built around Vanquish™ UHPLC coupled with Orbitrap™ Exploris™ 120 HRAM MS, supporting high-resolution metabolite profiling across suitable sample types.

Broad Metabolite Profiling

Untargeted analysis captures a wide range of small-molecule signals, helping researchers explore global metabolic changes without limiting the study to predefined targets.

Broad Metabolite Profiling

Untargeted analysis captures a wide range of small-molecule signals, helping researchers explore global metabolic changes without limiting the study to predefined targets.

Differential Metabolite Discovery

Statistical analysis helps identify metabolites that differ between sample groups, supporting studies of biological response, disease mechanisms and treatment effects.

Differential Metabolite Discovery

Statistical analysis helps identify metabolites that differ between sample groups, supporting studies of biological response, disease mechanisms and treatment effects.

Pathway-level Interpretation

Metabolite annotation and pathway analysis help connect biochemical changes with underlying biological processes and broader multi-omics research questions.

Pathway-level Interpretation

Metabolite annotation and pathway analysis help connect biochemical changes with underlying biological processes and broader multi-omics research questions.

Service Highlights

High-resolution LC-MS Workflow

Built around Vanquish™ UHPLC coupled with Orbitrap™ Exploris™ 120 HRAM MS, supporting high-resolution metabolite profiling across suitable sample types.

High-resolution LC-MS Workflow

Built around Vanquish™ UHPLC coupled with Orbitrap™ Exploris™ 120 HRAM MS, supporting high-resolution metabolite profiling across suitable sample types.

Broad Metabolite Profiling

Untargeted analysis captures a wide range of small-molecule signals, helping researchers explore global metabolic changes without limiting the study to predefined targets.

Broad Metabolite Profiling

Untargeted analysis captures a wide range of small-molecule signals, helping researchers explore global metabolic changes without limiting the study to predefined targets.

Differential Metabolite Discovery

Statistical analysis helps identify metabolites that differ between sample groups, supporting studies of biological response, disease mechanisms and treatment effects.

Differential Metabolite Discovery

Statistical analysis helps identify metabolites that differ between sample groups, supporting studies of biological response, disease mechanisms and treatment effects.

Pathway-level Interpretation

Metabolite annotation and pathway analysis help connect biochemical changes with underlying biological processes and broader multi-omics research questions.

Pathway-level Interpretation

Metabolite annotation and pathway analysis help connect biochemical changes with underlying biological processes and broader multi-omics research questions.

Applications

Disease Mechanism Research

Untargeted metabolomics helps researchers explore metabolic changes associated with disease development, progression and underlying biochemical mechanisms.

Disease Mechanism Research

Untargeted metabolomics helps researchers explore metabolic changes associated with disease development, progression and underlying biochemical mechanisms.

Microbiome and Host Interaction

Metabolite profiling can support studies of microbiome activity, host–microbe interactions and biochemical changes linked to microbial communities.

Microbiome and Host Interaction

Metabolite profiling can support studies of microbiome activity, host–microbe interactions and biochemical changes linked to microbial communities.

Treatment Response Studies

Global metabolite analysis can help investigate biological responses to treatments, interventions or experimental conditions across suitable sample types.

Treatment Response Studies

Global metabolite analysis can help investigate biological responses to treatments, interventions or experimental conditions across suitable sample types.

Biomarker and Pathway Discovery

Differential metabolite and pathway analysis can support biomarker discovery and reveal pathway-level changes linked to biological phenotypes.

Biomarker and Pathway Discovery

Differential metabolite and pathway analysis can support biomarker discovery and reveal pathway-level changes linked to biological phenotypes.

Applications

Disease Mechanism Research

Untargeted metabolomics helps researchers explore metabolic changes associated with disease development, progression and underlying biochemical mechanisms.

Disease Mechanism Research

Untargeted metabolomics helps researchers explore metabolic changes associated with disease development, progression and underlying biochemical mechanisms.

Microbiome and Host Interaction

Metabolite profiling can support studies of microbiome activity, host–microbe interactions and biochemical changes linked to microbial communities.

Microbiome and Host Interaction

Metabolite profiling can support studies of microbiome activity, host–microbe interactions and biochemical changes linked to microbial communities.

Treatment Response Studies

Global metabolite analysis can help investigate biological responses to treatments, interventions or experimental conditions across suitable sample types.

Treatment Response Studies

Global metabolite analysis can help investigate biological responses to treatments, interventions or experimental conditions across suitable sample types.

Biomarker and Pathway Discovery

Differential metabolite and pathway analysis can support biomarker discovery and reveal pathway-level changes linked to biological phenotypes.

Biomarker and Pathway Discovery

Differential metabolite and pathway analysis can support biomarker discovery and reveal pathway-level changes linked to biological phenotypes.

Specifications

Sample Requirements

The quantities listed are provided for reference only. Please download the Sample Requirements for detailed guidance, or contact us to discuss your project-specific requirements.

Sample TypeMinimum amountRecommended amount
Human & Animal Tissue20 mg 100 mg
Plant Tissue20 mg100 mg
Plasma/ Serum20 μL100 μL
Urine20 μL100 μL
Saliva100 μL200 μL
Feces/Intestinal contents20 mg100 mg
Amniotic fluid/Bile/Tear, etc100 μL200 μL
Supernatant/Fermentation broth1 mL2 mL
Microbial thallus10 uL 50 uL
Microbial solution1 mL2 mL
Cell pellets ≥10⁶ cells1×10⁷ cells
Culture medium 100 mg 200 mg

Sample Requirements

The quantities listed are provided for reference only. Please download the Sample Requirements for detailed guidance, or contact us to discuss your project-specific requirements.

Sample TypeMinimum amountRecommended amount
Human & Animal Tissue20 mg 100 mg
Plant Tissue20 mg100 mg
Plasma/ Serum20 μL100 μL
Urine20 μL100 μL
Saliva100 μL200 μL
Feces/Intestinal contents20 mg100 mg
Amniotic fluid/Bile/Tear, etc100 μL200 μL
Supernatant/Fermentation broth1 mL2 mL
Microbial thallus10 uL 50 uL
Microbial solution1 mL2 mL
Cell pellets ≥10⁶ cells1×10⁷ cells
Culture medium 100 mg 200 mg

Sample Requirements

The quantities listed are provided for reference only. Please download the Sample Requirements for detailed guidance, or contact us to discuss your project-specific requirements.

Sample TypeMinimum amountRecommended amount
Human & Animal Tissue20 mg 100 mg
Plant Tissue20 mg100 mg
Plasma/ Serum20 μL100 μL
Urine20 μL100 μL
Saliva100 μL200 μL
Feces/Intestinal contents20 mg100 mg
Amniotic fluid/Bile/Tear, etc100 μL200 μL
Supernatant/Fermentation broth1 mL2 mL
Microbial thallus10 uL 50 uL
Microbial solution1 mL2 mL
Cell pellets ≥10⁶ cells1×10⁷ cells
Culture medium 100 mg 200 mg

Sample Requirements

The quantities listed are provided for reference only. Please download the Sample Requirements for detailed guidance, or contact us to discuss your project-specific requirements.

Sample TypeMinimum amountRecommended amount
Human & Animal Tissue20 mg 100 mg
Plant Tissue20 mg100 mg
Plasma/ Serum20 μL100 μL
Urine20 μL100 μL
Saliva100 μL200 μL
Feces/Intestinal contents20 mg100 mg
Amniotic fluid/Bile/Tear, etc100 μL200 μL
Supernatant/Fermentation broth1 mL2 mL
Microbial thallus10 uL 50 uL
Microbial solution1 mL2 mL
Cell pellets ≥10⁶ cells1×10⁷ cells
Culture medium 100 mg 200 mg

LC-MS Profiling and Analysis

Recommended data outputs and analysis examples are provided for reference only. For detailed information, please contact us to discuss your project-specific analysis requirements.

Platform TypeQ Exactive™ HF-X Platform Performance Parameters
Resolution240,000 @ m/z 200
Mass Range50–6,000 m/z
Scan RateUp to 40 Hz
Mass AccuracyInternal standard <1 ppm
RMS; external standard <3 ppm RMS
SensitivityFull scan MS: 100 fg on-column with a signal-to-noise ratio (S/N) of 150:1
SIM: 50 fg on-column with a signal-to-noise ratio (S/N) of 150:1
Dynamic Range> 5,000:1

LC-MS Profiling and Analysis

Recommended data outputs and analysis examples are provided for reference only. For detailed information, please contact us to discuss your project-specific analysis requirements.

Platform TypeQ Exactive™ HF-X Platform Performance Parameters
Resolution240,000 @ m/z 200
Mass Range50–6,000 m/z
Scan RateUp to 40 Hz
Mass AccuracyInternal standard <1 ppm
RMS; external standard <3 ppm RMS
SensitivityFull scan MS: 100 fg on-column with a signal-to-noise ratio (S/N) of 150:1
SIM: 50 fg on-column with a signal-to-noise ratio (S/N) of 150:1
Dynamic Range> 5,000:1

LC-MS Profiling and Analysis

Recommended data outputs and analysis examples are provided for reference only. For detailed information, please contact us to discuss your project-specific analysis requirements.

Platform TypeQ Exactive™ HF-X Platform Performance Parameters
Resolution240,000 @ m/z 200
Mass Range50–6,000 m/z
Scan RateUp to 40 Hz
Mass AccuracyInternal standard <1 ppm
RMS; external standard <3 ppm RMS
SensitivityFull scan MS: 100 fg on-column with a signal-to-noise ratio (S/N) of 150:1
SIM: 50 fg on-column with a signal-to-noise ratio (S/N) of 150:1
Dynamic Range> 5,000:1

LC-MS Profiling and Analysis

Recommended data outputs and analysis examples are provided for reference only. For detailed information, please contact us to discuss your project-specific analysis requirements.

Platform TypeQ Exactive™ HF-X Platform Performance Parameters
Resolution240,000 @ m/z 200
Mass Range50–6,000 m/z
Scan RateUp to 40 Hz
Mass AccuracyInternal standard <1 ppm
RMS; external standard <3 ppm RMS
SensitivityFull scan MS: 100 fg on-column with a signal-to-noise ratio (S/N) of 150:1
SIM: 50 fg on-column with a signal-to-noise ratio (S/N) of 150:1
Dynamic Range> 5,000:1

Specifications

Sample Requirements

The quantities listed are provided for reference only. Please download the Sample Requirements for detailed guidance, or contact us to discuss your project-specific requirements.

Sample TypeMinimum amountRecommended amount
Human & Animal Tissue20 mg 100 mg
Plant Tissue20 mg100 mg
Plasma/ Serum20 μL100 μL
Urine20 μL100 μL
Saliva100 μL200 μL
Feces/Intestinal contents20 mg100 mg
Amniotic fluid/Bile/Tear, etc100 μL200 μL
Supernatant/Fermentation broth1 mL2 mL
Microbial thallus10 uL 50 uL
Microbial solution1 mL2 mL
Cell pellets ≥10⁶ cells1×10⁷ cells
Culture medium 100 mg 200 mg

Sample Requirements

The quantities listed are provided for reference only. Please download the Sample Requirements for detailed guidance, or contact us to discuss your project-specific requirements.

Sample TypeMinimum amountRecommended amount
Human & Animal Tissue20 mg 100 mg
Plant Tissue20 mg100 mg
Plasma/ Serum20 μL100 μL
Urine20 μL100 μL
Saliva100 μL200 μL
Feces/Intestinal contents20 mg100 mg
Amniotic fluid/Bile/Tear, etc100 μL200 μL
Supernatant/Fermentation broth1 mL2 mL
Microbial thallus10 uL 50 uL
Microbial solution1 mL2 mL
Cell pellets ≥10⁶ cells1×10⁷ cells
Culture medium 100 mg 200 mg

Sample Requirements

The quantities listed are provided for reference only. Please download the Sample Requirements for detailed guidance, or contact us to discuss your project-specific requirements.

Sample TypeMinimum amountRecommended amount
Human & Animal Tissue20 mg 100 mg
Plant Tissue20 mg100 mg
Plasma/ Serum20 μL100 μL
Urine20 μL100 μL
Saliva100 μL200 μL
Feces/Intestinal contents20 mg100 mg
Amniotic fluid/Bile/Tear, etc100 μL200 μL
Supernatant/Fermentation broth1 mL2 mL
Microbial thallus10 uL 50 uL
Microbial solution1 mL2 mL
Cell pellets ≥10⁶ cells1×10⁷ cells
Culture medium 100 mg 200 mg

Sample Requirements

The quantities listed are provided for reference only. Please download the Sample Requirements for detailed guidance, or contact us to discuss your project-specific requirements.

Sample TypeMinimum amountRecommended amount
Human & Animal Tissue20 mg 100 mg
Plant Tissue20 mg100 mg
Plasma/ Serum20 μL100 μL
Urine20 μL100 μL
Saliva100 μL200 μL
Feces/Intestinal contents20 mg100 mg
Amniotic fluid/Bile/Tear, etc100 μL200 μL
Supernatant/Fermentation broth1 mL2 mL
Microbial thallus10 uL 50 uL
Microbial solution1 mL2 mL
Cell pellets ≥10⁶ cells1×10⁷ cells
Culture medium 100 mg 200 mg

LC-MS Profiling and Analysis

Recommended data outputs and analysis examples are provided for reference only. For detailed information, please contact us to discuss your project-specific analysis requirements.

Platform TypeQ Exactive™ HF-X Platform Performance Parameters
Resolution240,000 @ m/z 200
Mass Range50–6,000 m/z
Scan RateUp to 40 Hz
Mass AccuracyInternal standard <1 ppm
RMS; external standard <3 ppm RMS
SensitivityFull scan MS: 100 fg on-column with a signal-to-noise ratio (S/N) of 150:1
SIM: 50 fg on-column with a signal-to-noise ratio (S/N) of 150:1
Dynamic Range> 5,000:1

LC-MS Profiling and Analysis

Recommended data outputs and analysis examples are provided for reference only. For detailed information, please contact us to discuss your project-specific analysis requirements.

Platform TypeQ Exactive™ HF-X Platform Performance Parameters
Resolution240,000 @ m/z 200
Mass Range50–6,000 m/z
Scan RateUp to 40 Hz
Mass AccuracyInternal standard <1 ppm
RMS; external standard <3 ppm RMS
SensitivityFull scan MS: 100 fg on-column with a signal-to-noise ratio (S/N) of 150:1
SIM: 50 fg on-column with a signal-to-noise ratio (S/N) of 150:1
Dynamic Range> 5,000:1

LC-MS Profiling and Analysis

Recommended data outputs and analysis examples are provided for reference only. For detailed information, please contact us to discuss your project-specific analysis requirements.

Platform TypeQ Exactive™ HF-X Platform Performance Parameters
Resolution240,000 @ m/z 200
Mass Range50–6,000 m/z
Scan RateUp to 40 Hz
Mass AccuracyInternal standard <1 ppm
RMS; external standard <3 ppm RMS
SensitivityFull scan MS: 100 fg on-column with a signal-to-noise ratio (S/N) of 150:1
SIM: 50 fg on-column with a signal-to-noise ratio (S/N) of 150:1
Dynamic Range> 5,000:1

LC-MS Profiling and Analysis

Recommended data outputs and analysis examples are provided for reference only. For detailed information, please contact us to discuss your project-specific analysis requirements.

Platform TypeQ Exactive™ HF-X Platform Performance Parameters
Resolution240,000 @ m/z 200
Mass Range50–6,000 m/z
Scan RateUp to 40 Hz
Mass AccuracyInternal standard <1 ppm
RMS; external standard <3 ppm RMS
SensitivityFull scan MS: 100 fg on-column with a signal-to-noise ratio (S/N) of 150:1
SIM: 50 fg on-column with a signal-to-noise ratio (S/N) of 150:1
Dynamic Range> 5,000:1

Resources

Example Analysis Output

Image
Image
1/1
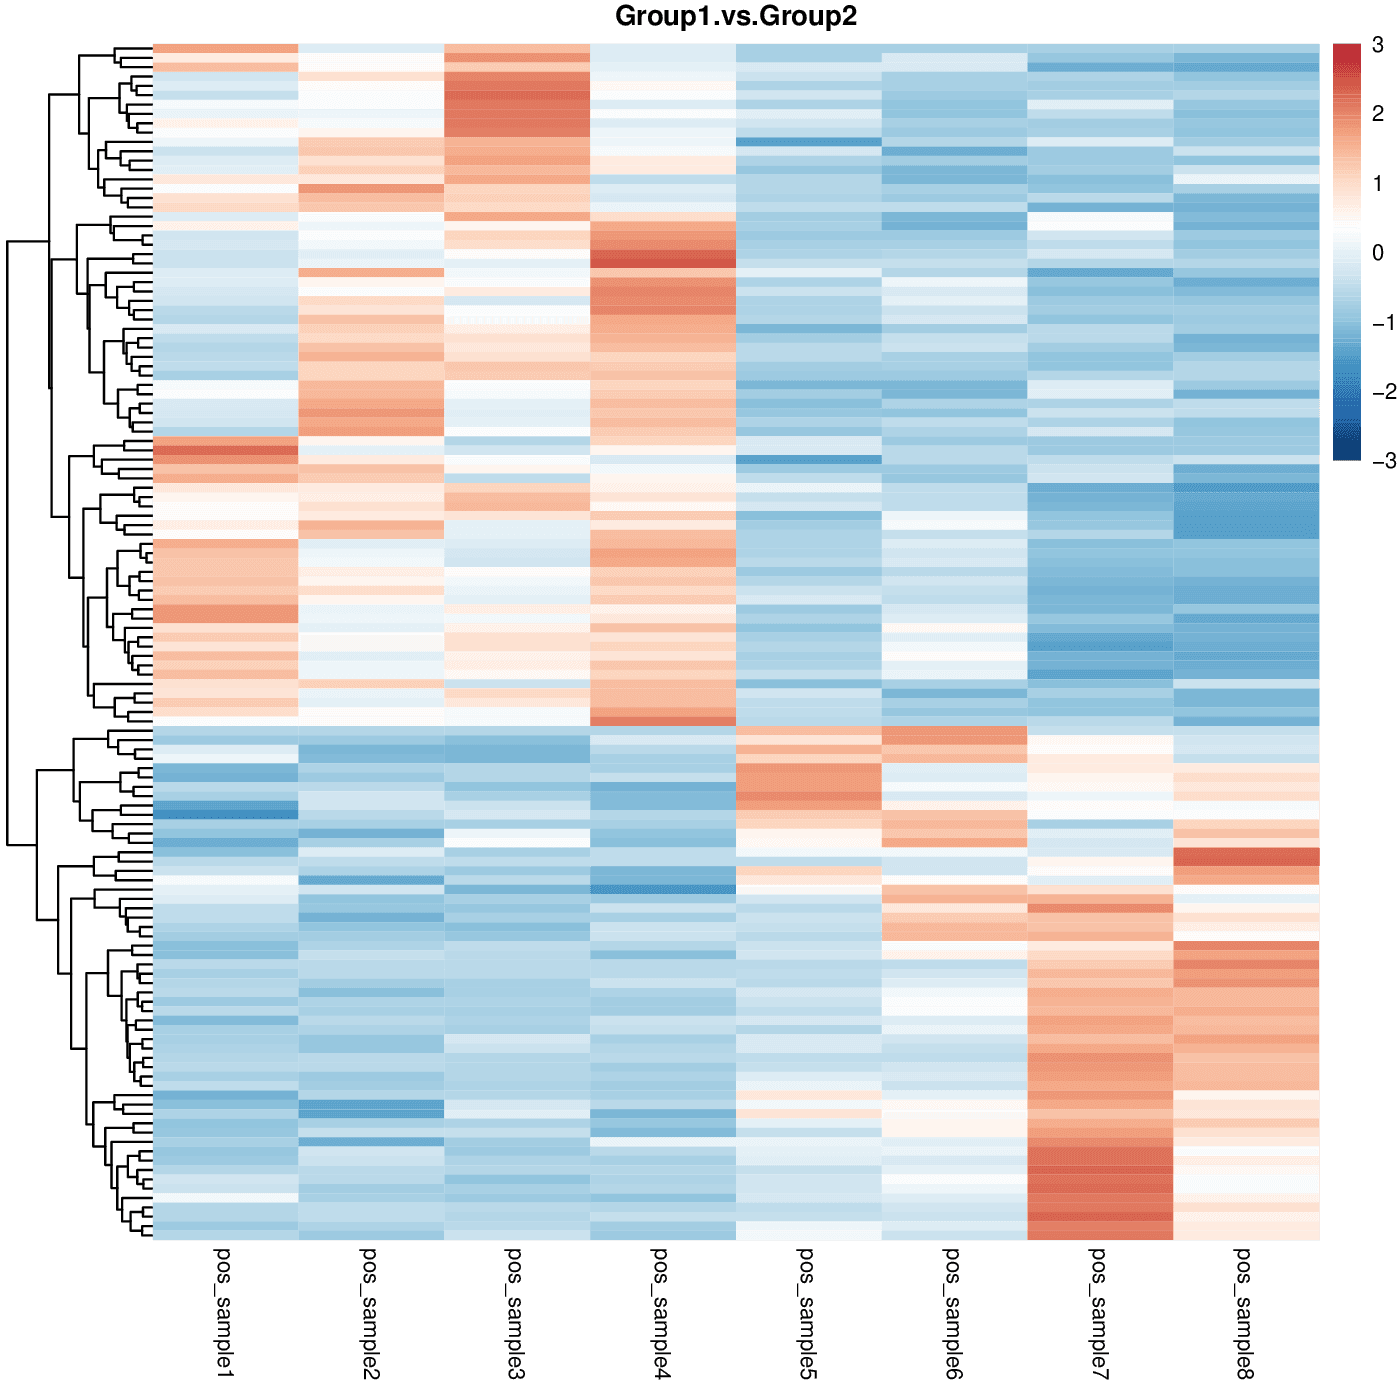
Metabolite Heatmap

Visualise relative abundance patterns of differential metabolites across samples and experimental groups.

Image
Image
1/1
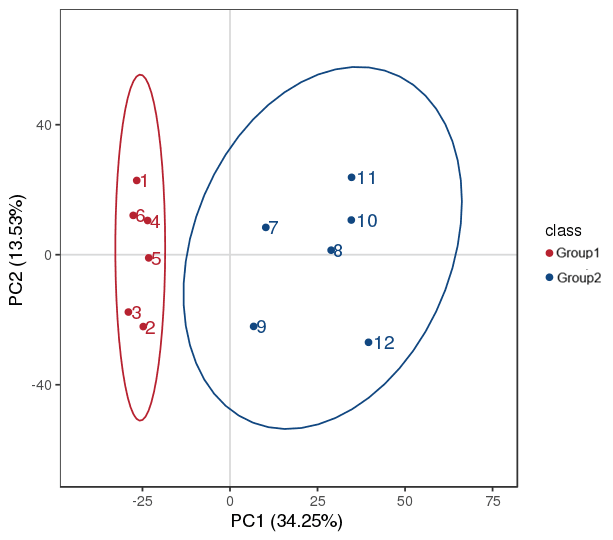
Sample-level Variation

Use PCA to assess overall metabolite profile variation and group separation across samples.

Image
Image
1/1
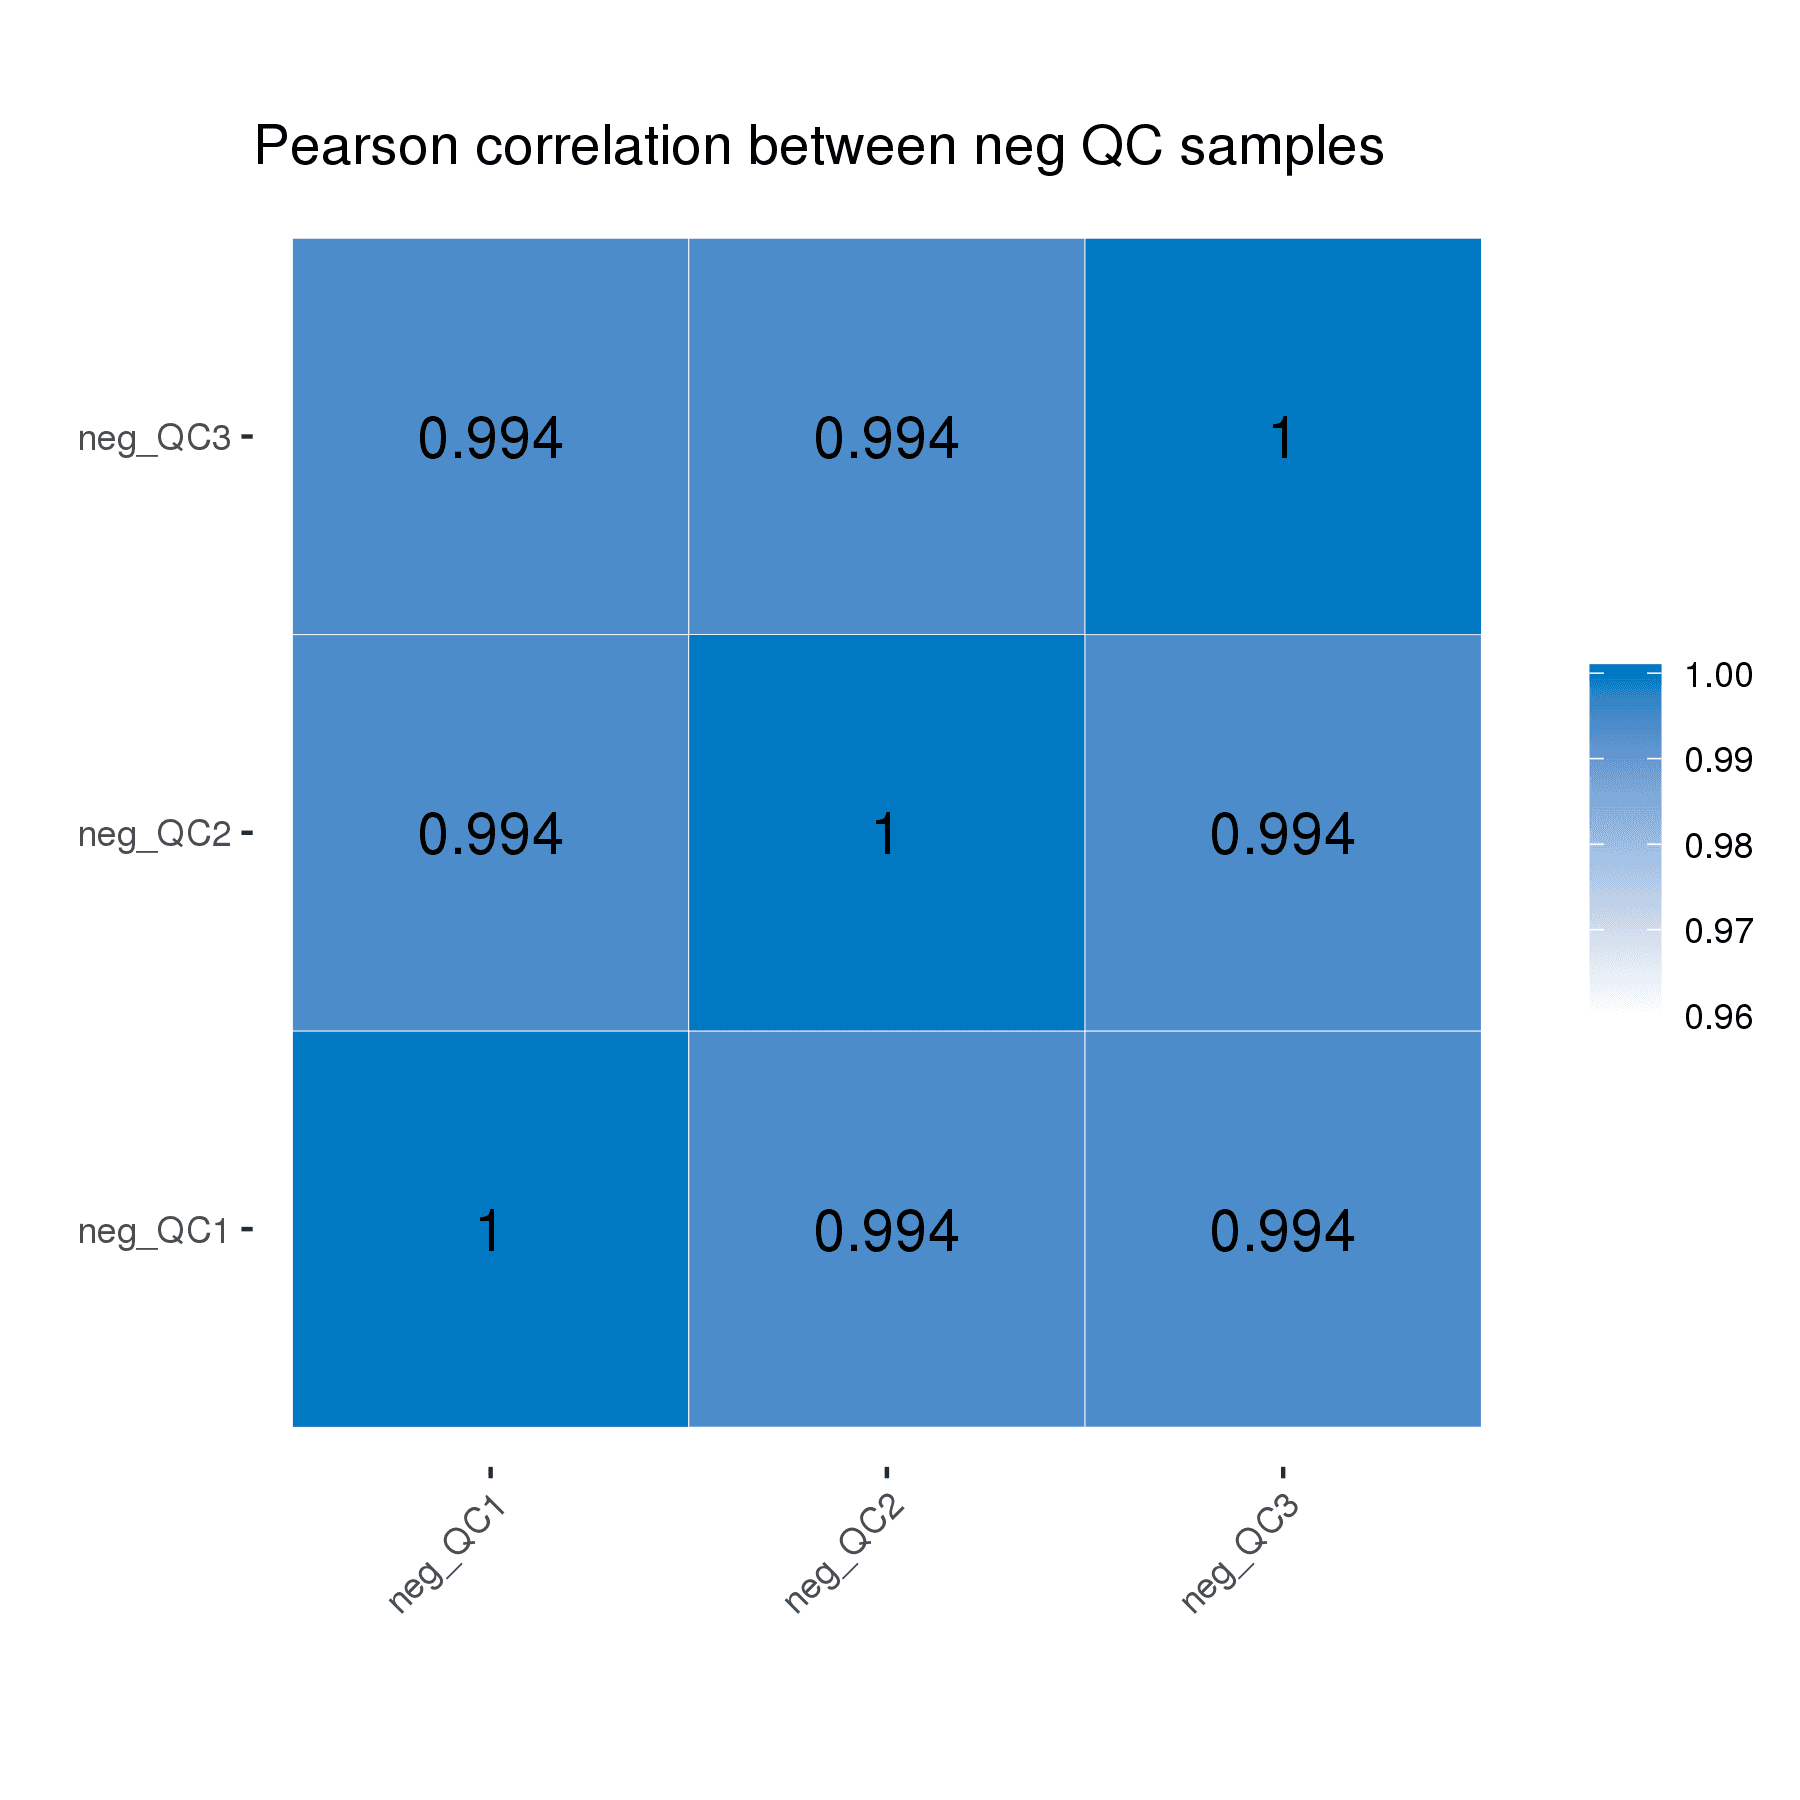
Sample Correlation

Review correlation patterns between samples to evaluate overall data consistency and biological grouping.

Image
Image
1/1
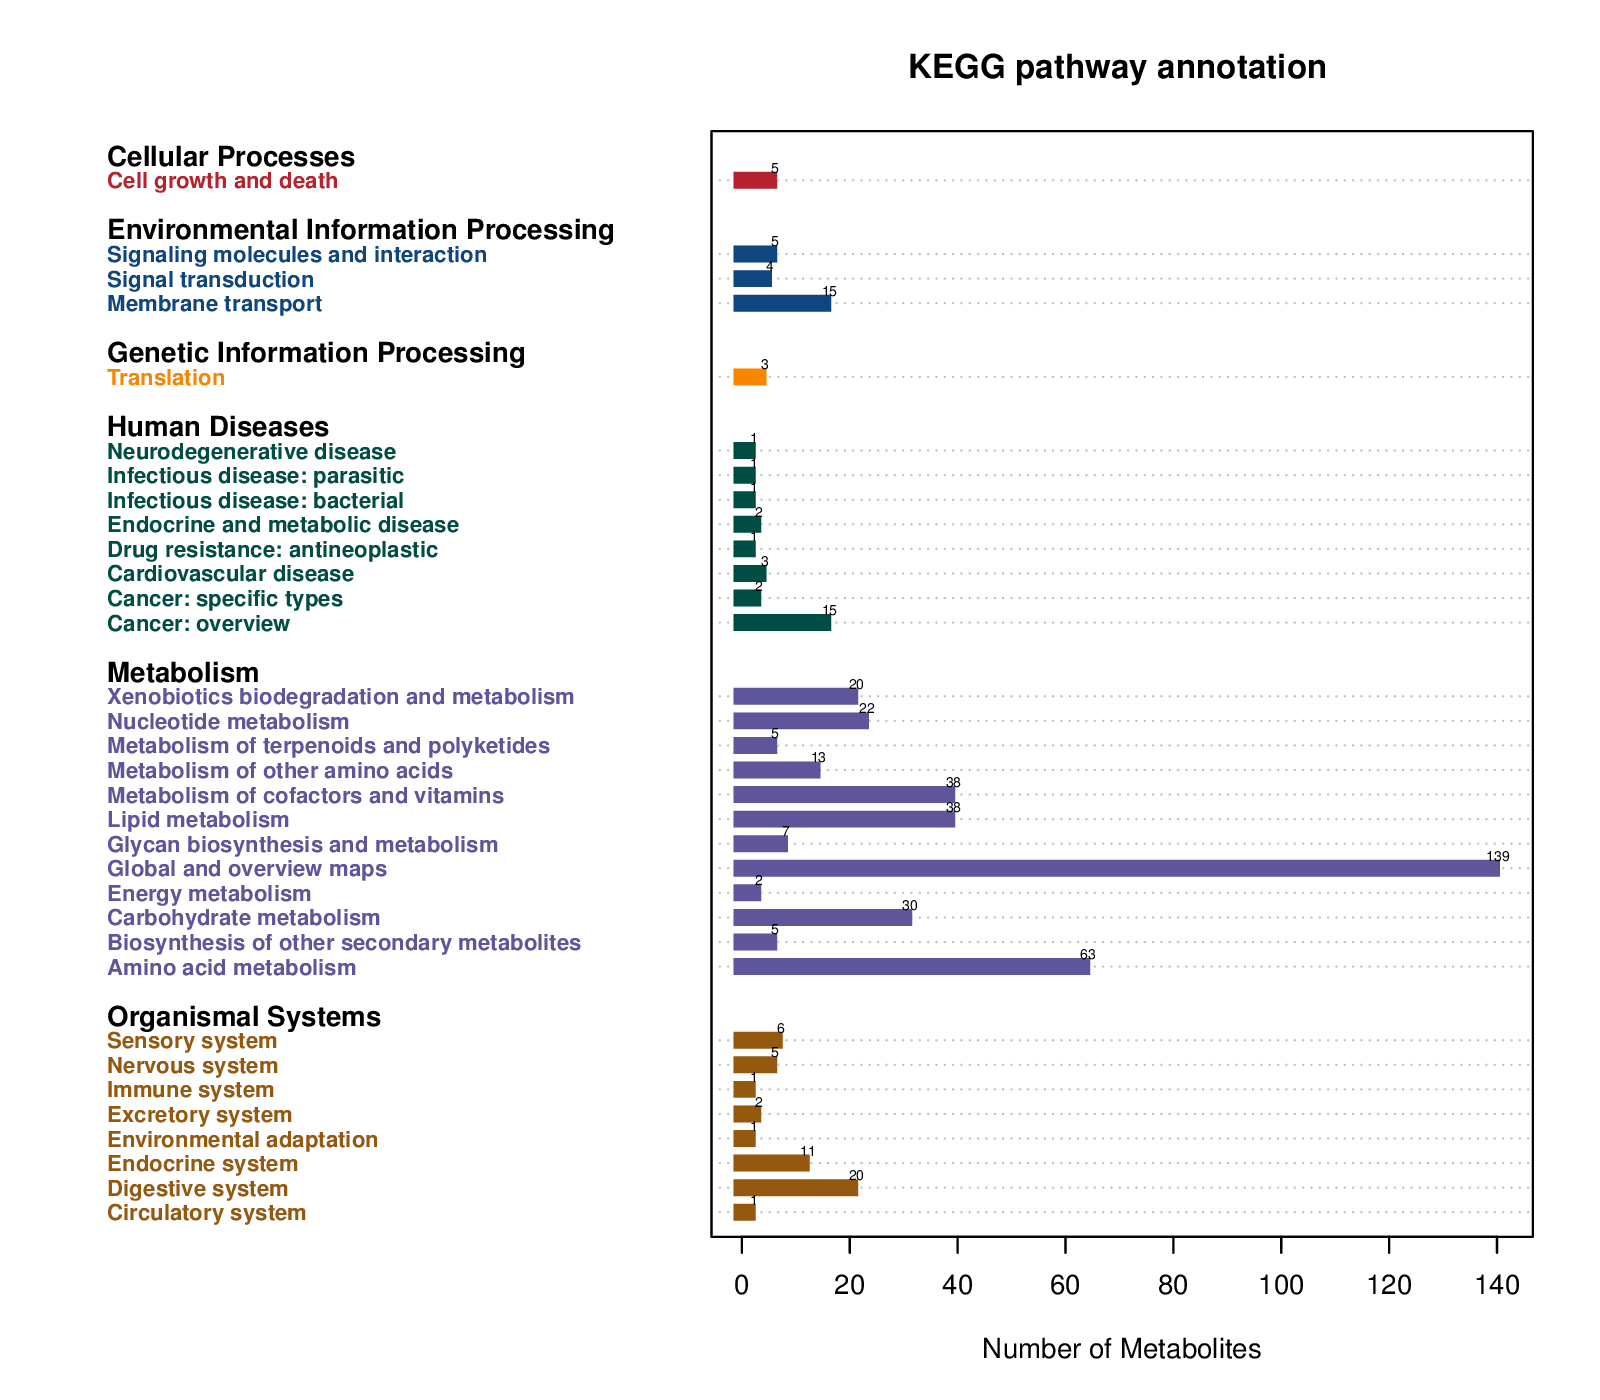
KEGG Annotation

Summarise annotated metabolites by KEGG pathway category to support pathway-level interpretation.

Image
Image
1/1
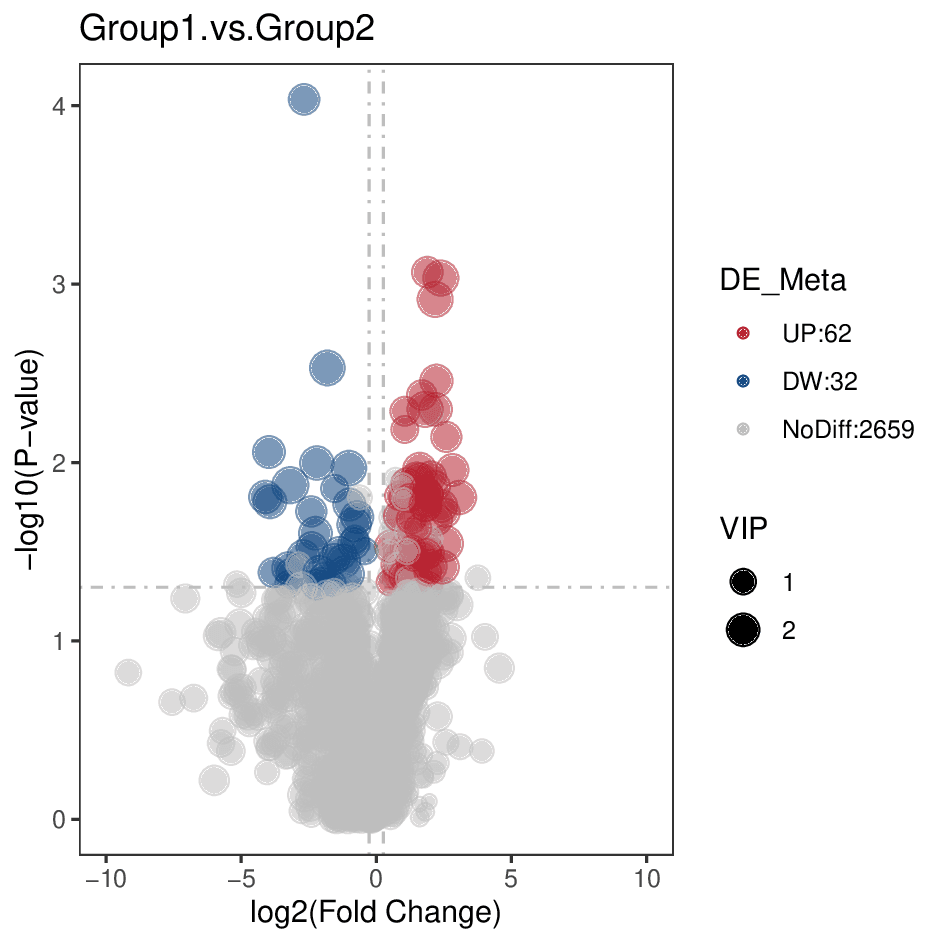
Metabolite Volcano Plot

Highlight significantly changed metabolites based on fold change and statistical significance.

Image
Image
1/1
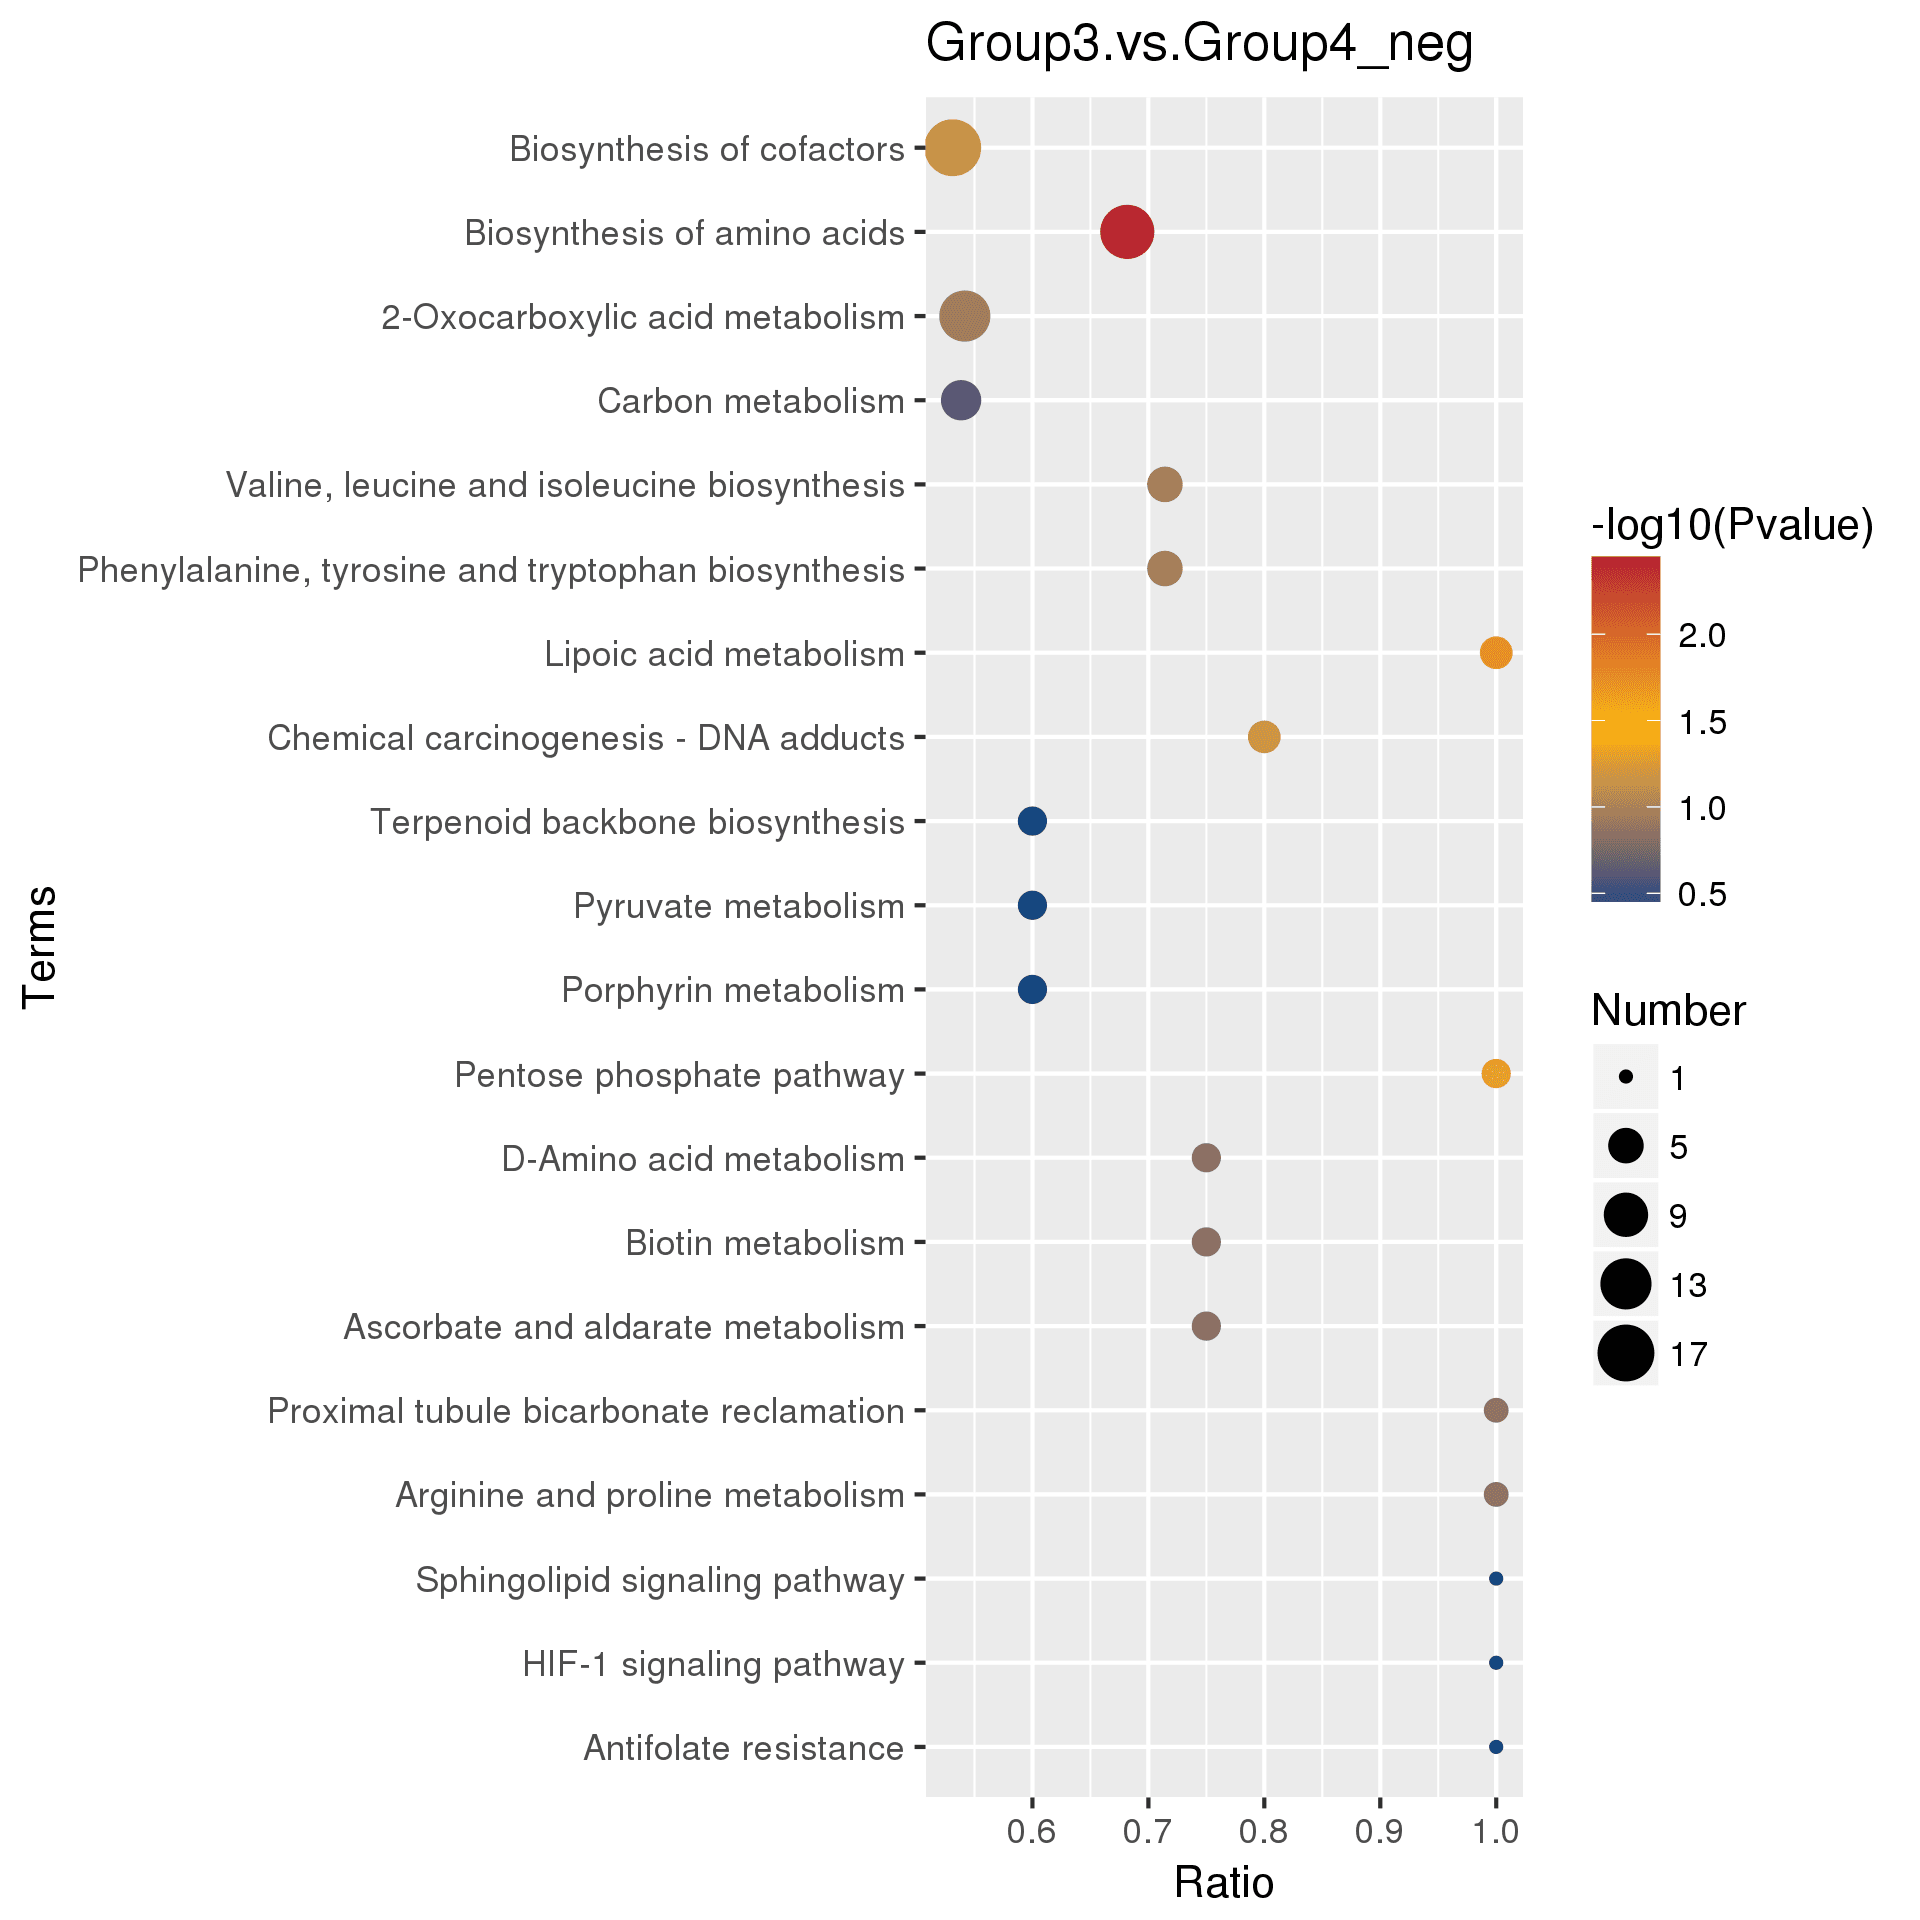
KEGG Enrichment Analysis

Identify enriched metabolic pathways associated with differential metabolites across comparison groups.

Image
Image
1/1
Metabolite Heatmap

Visualise relative abundance patterns of differential metabolites across samples and experimental groups.

Image
Image
1/1
Sample-level Variation

Use PCA to assess overall metabolite profile variation and group separation across samples.

Image
Image
1/1
Sample Correlation

Review correlation patterns between samples to evaluate overall data consistency and biological grouping.

Image
Image
1/1
KEGG Annotation

Summarise annotated metabolites by KEGG pathway category to support pathway-level interpretation.

Image
Image
1/1
Metabolite Volcano Plot

Highlight significantly changed metabolites based on fold change and statistical significance.

Image
Image
1/1
KEGG Enrichment Analysis

Identify enriched metabolic pathways associated with differential metabolites across comparison groups.

Image
Image
1/1
Metabolite Heatmap

Visualise relative abundance patterns of differential metabolites across samples and experimental groups.

Image
Image
1/1
Sample-level Variation

Use PCA to assess overall metabolite profile variation and group separation across samples.

Image
Image
1/1
Sample Correlation

Review correlation patterns between samples to evaluate overall data consistency and biological grouping.

Image
Image
1/1
KEGG Annotation

Summarise annotated metabolites by KEGG pathway category to support pathway-level interpretation.

Image
Image
1/1
Metabolite Volcano Plot

Highlight significantly changed metabolites based on fold change and statistical significance.

Image
Image
1/1
KEGG Enrichment Analysis

Identify enriched metabolic pathways associated with differential metabolites across comparison groups.

Image
Image
1/1
Metabolite Heatmap

Visualise relative abundance patterns of differential metabolites across samples and experimental groups.

Image
Image
1/1
Sample-level Variation

Use PCA to assess overall metabolite profile variation and group separation across samples.

Image
Image
1/1
Sample Correlation

Review correlation patterns between samples to evaluate overall data consistency and biological grouping.

Image
Image
1/1
KEGG Annotation

Summarise annotated metabolites by KEGG pathway category to support pathway-level interpretation.

Image
Image
1/1
Metabolite Volcano Plot

Highlight significantly changed metabolites based on fold change and statistical significance.

Image
Image
1/1
KEGG Enrichment Analysis

Identify enriched metabolic pathways associated with differential metabolites across comparison groups.

Webinars

From Genes to Function: Introduction to Metabolomics for Multi-Omics Study

Learn how metabolomics complements genomics and transcriptomics by providing a direct view of cellular activity. We will explore untargeted metabolomics workflows, practical applications, and key considerations for integrating metabolomics into multi-omics studies.

Learn More
(From Genes to Function: Introduction to Metabolomics for Multi-Omics Study)
From Genes to Function: Introduction to Metabolomics for Multi-Omics Study

Learn how metabolomics complements genomics and transcriptomics by providing a direct view of cellular activity. We will explore untargeted metabolomics workflows, practical applications, and key considerations for integrating metabolomics into multi-omics studies.

Learn More
(From Genes to Function: Introduction to Metabolomics for Multi-Omics Study)
From Genes to Function: Introduction to Metabolomics for Multi-Omics Study

Learn how metabolomics complements genomics and transcriptomics by providing a direct view of cellular activity. We will explore untargeted metabolomics workflows, practical applications, and key considerations for integrating metabolomics into multi-omics studies.

Learn More
(From Genes to Function: Introduction to Metabolomics for Multi-Omics Study)
From Genes to Function: Introduction to Metabolomics for Multi-Omics Study

Learn how metabolomics complements genomics and transcriptomics by providing a direct view of cellular activity. We will explore untargeted metabolomics workflows, practical applications, and key considerations for integrating metabolomics into multi-omics studies.

Learn More
(From Genes to Function: Introduction to Metabolomics for Multi-Omics Study)

Frequently Asked Questions

Why does untargeted metabolomics use both positive and negative ion modes?

Different metabolites ionise differently in mass spectrometry. Some compounds are more easily detected in positive ion mode, while others are better detected in negative ion mode. Using both modes helps improve metabolome coverage and supports broader small-molecule profiling.


Positive and negative ion mode data are usually processed separately. If combined interpretation or customised bioinformatics analysis is required, this should be discussed during project setup.


Can I compare the abundance of different metabolites within the same sample?

Why might a specific compound not be detected in untargeted metabolomics?

How many metabolites or features can untargeted metabolomics detect?

Explore Metabolomics Resources

Access webinars, brochures and case studies covering sequencing technologies, study planning and data interpretation.
View Webinar Library
(Explore Metabolomics Resources)
View Webinar Library
(Explore Metabolomics Resources)
Background
Background

Speak with a Specialist

Have a project in mind?


Send us your enquiry and a Novogene Europe specialist will be in touch.


Privacy PolicyCookie PolicyTerms
banner laptop bg
banner mobile bg

Untargeted Metabolomics

Comprehensive high-resolution small-molecule profiling to reveal global metabolic changes, identify differential metabolites, and support biological discovery.
OverviewOverview
BenefitsBenefits
ApplicationsApplications
SpecificationsSpecifications
ResourcesResources

Untargeted metabolomics provides a broad view of small-molecule changes that sit close to phenotype, helping researchers explore the biochemical activity underlying complex biological systems. Using liquid chromatography–mass spectrometry (LC-MS), this approach supports discovery-led analysis across suitable biological sample types, conditions and experimental groups.


Novogene Europe supports untargeted metabolomics projects through its Cambridge Omics Centre, using high-resolution LC-MS analysis, metabolite annotation and bioinformatics workflows. The service helps researchers investigate differential metabolites, pathway changes, disease mechanisms, microbiome interactions and treatment response, with potential integration alongside other omics data.

Service Highlights

High-resolution LC-MS Workflow

Built around Vanquish™ UHPLC coupled with Orbitrap™ Exploris™ 120 HRAM MS, supporting high-resolution metabolite profiling across suitable sample types.

High-resolution LC-MS Workflow

Built around Vanquish™ UHPLC coupled with Orbitrap™ Exploris™ 120 HRAM MS, supporting high-resolution metabolite profiling across suitable sample types.

Broad Metabolite Profiling

Untargeted analysis captures a wide range of small-molecule signals, helping researchers explore global metabolic changes without limiting the study to predefined targets.

Broad Metabolite Profiling

Untargeted analysis captures a wide range of small-molecule signals, helping researchers explore global metabolic changes without limiting the study to predefined targets.

Differential Metabolite Discovery

Statistical analysis helps identify metabolites that differ between sample groups, supporting studies of biological response, disease mechanisms and treatment effects.

Differential Metabolite Discovery

Statistical analysis helps identify metabolites that differ between sample groups, supporting studies of biological response, disease mechanisms and treatment effects.

Pathway-level Interpretation

Metabolite annotation and pathway analysis help connect biochemical changes with underlying biological processes and broader multi-omics research questions.

Pathway-level Interpretation

Metabolite annotation and pathway analysis help connect biochemical changes with underlying biological processes and broader multi-omics research questions.

Service Highlights

High-resolution LC-MS Workflow

Built around Vanquish™ UHPLC coupled with Orbitrap™ Exploris™ 120 HRAM MS, supporting high-resolution metabolite profiling across suitable sample types.

High-resolution LC-MS Workflow

Built around Vanquish™ UHPLC coupled with Orbitrap™ Exploris™ 120 HRAM MS, supporting high-resolution metabolite profiling across suitable sample types.

Broad Metabolite Profiling

Untargeted analysis captures a wide range of small-molecule signals, helping researchers explore global metabolic changes without limiting the study to predefined targets.

Broad Metabolite Profiling

Untargeted analysis captures a wide range of small-molecule signals, helping researchers explore global metabolic changes without limiting the study to predefined targets.

Differential Metabolite Discovery

Statistical analysis helps identify metabolites that differ between sample groups, supporting studies of biological response, disease mechanisms and treatment effects.

Differential Metabolite Discovery

Statistical analysis helps identify metabolites that differ between sample groups, supporting studies of biological response, disease mechanisms and treatment effects.

Pathway-level Interpretation

Metabolite annotation and pathway analysis help connect biochemical changes with underlying biological processes and broader multi-omics research questions.

Pathway-level Interpretation

Metabolite annotation and pathway analysis help connect biochemical changes with underlying biological processes and broader multi-omics research questions.

Applications

Disease Mechanism Research

Untargeted metabolomics helps researchers explore metabolic changes associated with disease development, progression and underlying biochemical mechanisms.

Disease Mechanism Research

Untargeted metabolomics helps researchers explore metabolic changes associated with disease development, progression and underlying biochemical mechanisms.

Microbiome and Host Interaction

Metabolite profiling can support studies of microbiome activity, host–microbe interactions and biochemical changes linked to microbial communities.

Microbiome and Host Interaction

Metabolite profiling can support studies of microbiome activity, host–microbe interactions and biochemical changes linked to microbial communities.

Treatment Response Studies

Global metabolite analysis can help investigate biological responses to treatments, interventions or experimental conditions across suitable sample types.

Treatment Response Studies

Global metabolite analysis can help investigate biological responses to treatments, interventions or experimental conditions across suitable sample types.

Biomarker and Pathway Discovery

Differential metabolite and pathway analysis can support biomarker discovery and reveal pathway-level changes linked to biological phenotypes.

Biomarker and Pathway Discovery

Differential metabolite and pathway analysis can support biomarker discovery and reveal pathway-level changes linked to biological phenotypes.

Applications

Disease Mechanism Research

Untargeted metabolomics helps researchers explore metabolic changes associated with disease development, progression and underlying biochemical mechanisms.

Disease Mechanism Research

Untargeted metabolomics helps researchers explore metabolic changes associated with disease development, progression and underlying biochemical mechanisms.

Microbiome and Host Interaction

Metabolite profiling can support studies of microbiome activity, host–microbe interactions and biochemical changes linked to microbial communities.

Microbiome and Host Interaction

Metabolite profiling can support studies of microbiome activity, host–microbe interactions and biochemical changes linked to microbial communities.

Treatment Response Studies

Global metabolite analysis can help investigate biological responses to treatments, interventions or experimental conditions across suitable sample types.

Treatment Response Studies

Global metabolite analysis can help investigate biological responses to treatments, interventions or experimental conditions across suitable sample types.

Biomarker and Pathway Discovery

Differential metabolite and pathway analysis can support biomarker discovery and reveal pathway-level changes linked to biological phenotypes.

Biomarker and Pathway Discovery

Differential metabolite and pathway analysis can support biomarker discovery and reveal pathway-level changes linked to biological phenotypes.

Specifications

Sample Requirements

The quantities listed are provided for reference only. Please download the Sample Requirements for detailed guidance, or contact us to discuss your project-specific requirements.

Sample TypeMinimum amountRecommended amount
Human & Animal Tissue20 mg 100 mg
Plant Tissue20 mg100 mg
Plasma/ Serum20 μL100 μL
Urine20 μL100 μL
Saliva100 μL200 μL
Feces/Intestinal contents20 mg100 mg
Amniotic fluid/Bile/Tear, etc100 μL200 μL
Supernatant/Fermentation broth1 mL2 mL
Microbial thallus10 uL 50 uL
Microbial solution1 mL2 mL
Cell pellets ≥10⁶ cells1×10⁷ cells
Culture medium 100 mg 200 mg

Sample Requirements

The quantities listed are provided for reference only. Please download the Sample Requirements for detailed guidance, or contact us to discuss your project-specific requirements.

Sample TypeMinimum amountRecommended amount
Human & Animal Tissue20 mg 100 mg
Plant Tissue20 mg100 mg
Plasma/ Serum20 μL100 μL
Urine20 μL100 μL
Saliva100 μL200 μL
Feces/Intestinal contents20 mg100 mg
Amniotic fluid/Bile/Tear, etc100 μL200 μL
Supernatant/Fermentation broth1 mL2 mL
Microbial thallus10 uL 50 uL
Microbial solution1 mL2 mL
Cell pellets ≥10⁶ cells1×10⁷ cells
Culture medium 100 mg 200 mg

Sample Requirements

The quantities listed are provided for reference only. Please download the Sample Requirements for detailed guidance, or contact us to discuss your project-specific requirements.

Sample TypeMinimum amountRecommended amount
Human & Animal Tissue20 mg 100 mg
Plant Tissue20 mg100 mg
Plasma/ Serum20 μL100 μL
Urine20 μL100 μL
Saliva100 μL200 μL
Feces/Intestinal contents20 mg100 mg
Amniotic fluid/Bile/Tear, etc100 μL200 μL
Supernatant/Fermentation broth1 mL2 mL
Microbial thallus10 uL 50 uL
Microbial solution1 mL2 mL
Cell pellets ≥10⁶ cells1×10⁷ cells
Culture medium 100 mg 200 mg

Sample Requirements

The quantities listed are provided for reference only. Please download the Sample Requirements for detailed guidance, or contact us to discuss your project-specific requirements.

Sample TypeMinimum amountRecommended amount
Human & Animal Tissue20 mg 100 mg
Plant Tissue20 mg100 mg
Plasma/ Serum20 μL100 μL
Urine20 μL100 μL
Saliva100 μL200 μL
Feces/Intestinal contents20 mg100 mg
Amniotic fluid/Bile/Tear, etc100 μL200 μL
Supernatant/Fermentation broth1 mL2 mL
Microbial thallus10 uL 50 uL
Microbial solution1 mL2 mL
Cell pellets ≥10⁶ cells1×10⁷ cells
Culture medium 100 mg 200 mg

LC-MS Profiling and Analysis

Recommended data outputs and analysis examples are provided for reference only. For detailed information, please contact us to discuss your project-specific analysis requirements.

Platform TypeQ Exactive™ HF-X Platform Performance Parameters
Resolution240,000 @ m/z 200
Mass Range50–6,000 m/z
Scan RateUp to 40 Hz
Mass AccuracyInternal standard <1 ppm
RMS; external standard <3 ppm RMS
SensitivityFull scan MS: 100 fg on-column with a signal-to-noise ratio (S/N) of 150:1
SIM: 50 fg on-column with a signal-to-noise ratio (S/N) of 150:1
Dynamic Range> 5,000:1

LC-MS Profiling and Analysis

Recommended data outputs and analysis examples are provided for reference only. For detailed information, please contact us to discuss your project-specific analysis requirements.

Platform TypeQ Exactive™ HF-X Platform Performance Parameters
Resolution240,000 @ m/z 200
Mass Range50–6,000 m/z
Scan RateUp to 40 Hz
Mass AccuracyInternal standard <1 ppm
RMS; external standard <3 ppm RMS
SensitivityFull scan MS: 100 fg on-column with a signal-to-noise ratio (S/N) of 150:1
SIM: 50 fg on-column with a signal-to-noise ratio (S/N) of 150:1
Dynamic Range> 5,000:1

LC-MS Profiling and Analysis

Recommended data outputs and analysis examples are provided for reference only. For detailed information, please contact us to discuss your project-specific analysis requirements.

Platform TypeQ Exactive™ HF-X Platform Performance Parameters
Resolution240,000 @ m/z 200
Mass Range50–6,000 m/z
Scan RateUp to 40 Hz
Mass AccuracyInternal standard <1 ppm
RMS; external standard <3 ppm RMS
SensitivityFull scan MS: 100 fg on-column with a signal-to-noise ratio (S/N) of 150:1
SIM: 50 fg on-column with a signal-to-noise ratio (S/N) of 150:1
Dynamic Range> 5,000:1

LC-MS Profiling and Analysis

Recommended data outputs and analysis examples are provided for reference only. For detailed information, please contact us to discuss your project-specific analysis requirements.

Platform TypeQ Exactive™ HF-X Platform Performance Parameters
Resolution240,000 @ m/z 200
Mass Range50–6,000 m/z
Scan RateUp to 40 Hz
Mass AccuracyInternal standard <1 ppm
RMS; external standard <3 ppm RMS
SensitivityFull scan MS: 100 fg on-column with a signal-to-noise ratio (S/N) of 150:1
SIM: 50 fg on-column with a signal-to-noise ratio (S/N) of 150:1
Dynamic Range> 5,000:1

Specifications

Sample Requirements

The quantities listed are provided for reference only. Please download the Sample Requirements for detailed guidance, or contact us to discuss your project-specific requirements.

Sample TypeMinimum amountRecommended amount
Human & Animal Tissue20 mg 100 mg
Plant Tissue20 mg100 mg
Plasma/ Serum20 μL100 μL
Urine20 μL100 μL
Saliva100 μL200 μL
Feces/Intestinal contents20 mg100 mg
Amniotic fluid/Bile/Tear, etc100 μL200 μL
Supernatant/Fermentation broth1 mL2 mL
Microbial thallus10 uL 50 uL
Microbial solution1 mL2 mL
Cell pellets ≥10⁶ cells1×10⁷ cells
Culture medium 100 mg 200 mg

Sample Requirements

The quantities listed are provided for reference only. Please download the Sample Requirements for detailed guidance, or contact us to discuss your project-specific requirements.

Sample TypeMinimum amountRecommended amount
Human & Animal Tissue20 mg 100 mg
Plant Tissue20 mg100 mg
Plasma/ Serum20 μL100 μL
Urine20 μL100 μL
Saliva100 μL200 μL
Feces/Intestinal contents20 mg100 mg
Amniotic fluid/Bile/Tear, etc100 μL200 μL
Supernatant/Fermentation broth1 mL2 mL
Microbial thallus10 uL 50 uL
Microbial solution1 mL2 mL
Cell pellets ≥10⁶ cells1×10⁷ cells
Culture medium 100 mg 200 mg

Sample Requirements

The quantities listed are provided for reference only. Please download the Sample Requirements for detailed guidance, or contact us to discuss your project-specific requirements.

Sample TypeMinimum amountRecommended amount
Human & Animal Tissue20 mg 100 mg
Plant Tissue20 mg100 mg
Plasma/ Serum20 μL100 μL
Urine20 μL100 μL
Saliva100 μL200 μL
Feces/Intestinal contents20 mg100 mg
Amniotic fluid/Bile/Tear, etc100 μL200 μL
Supernatant/Fermentation broth1 mL2 mL
Microbial thallus10 uL 50 uL
Microbial solution1 mL2 mL
Cell pellets ≥10⁶ cells1×10⁷ cells
Culture medium 100 mg 200 mg

Sample Requirements

The quantities listed are provided for reference only. Please download the Sample Requirements for detailed guidance, or contact us to discuss your project-specific requirements.

Sample TypeMinimum amountRecommended amount
Human & Animal Tissue20 mg 100 mg
Plant Tissue20 mg100 mg
Plasma/ Serum20 μL100 μL
Urine20 μL100 μL
Saliva100 μL200 μL
Feces/Intestinal contents20 mg100 mg
Amniotic fluid/Bile/Tear, etc100 μL200 μL
Supernatant/Fermentation broth1 mL2 mL
Microbial thallus10 uL 50 uL
Microbial solution1 mL2 mL
Cell pellets ≥10⁶ cells1×10⁷ cells
Culture medium 100 mg 200 mg

LC-MS Profiling and Analysis

Recommended data outputs and analysis examples are provided for reference only. For detailed information, please contact us to discuss your project-specific analysis requirements.

Platform TypeQ Exactive™ HF-X Platform Performance Parameters
Resolution240,000 @ m/z 200
Mass Range50–6,000 m/z
Scan RateUp to 40 Hz
Mass AccuracyInternal standard <1 ppm
RMS; external standard <3 ppm RMS
SensitivityFull scan MS: 100 fg on-column with a signal-to-noise ratio (S/N) of 150:1
SIM: 50 fg on-column with a signal-to-noise ratio (S/N) of 150:1
Dynamic Range> 5,000:1

LC-MS Profiling and Analysis

Recommended data outputs and analysis examples are provided for reference only. For detailed information, please contact us to discuss your project-specific analysis requirements.

Platform TypeQ Exactive™ HF-X Platform Performance Parameters
Resolution240,000 @ m/z 200
Mass Range50–6,000 m/z
Scan RateUp to 40 Hz
Mass AccuracyInternal standard <1 ppm
RMS; external standard <3 ppm RMS
SensitivityFull scan MS: 100 fg on-column with a signal-to-noise ratio (S/N) of 150:1
SIM: 50 fg on-column with a signal-to-noise ratio (S/N) of 150:1
Dynamic Range> 5,000:1

LC-MS Profiling and Analysis

Recommended data outputs and analysis examples are provided for reference only. For detailed information, please contact us to discuss your project-specific analysis requirements.

Platform TypeQ Exactive™ HF-X Platform Performance Parameters
Resolution240,000 @ m/z 200
Mass Range50–6,000 m/z
Scan RateUp to 40 Hz
Mass AccuracyInternal standard <1 ppm
RMS; external standard <3 ppm RMS
SensitivityFull scan MS: 100 fg on-column with a signal-to-noise ratio (S/N) of 150:1
SIM: 50 fg on-column with a signal-to-noise ratio (S/N) of 150:1
Dynamic Range> 5,000:1

LC-MS Profiling and Analysis

Recommended data outputs and analysis examples are provided for reference only. For detailed information, please contact us to discuss your project-specific analysis requirements.

Platform TypeQ Exactive™ HF-X Platform Performance Parameters
Resolution240,000 @ m/z 200
Mass Range50–6,000 m/z
Scan RateUp to 40 Hz
Mass AccuracyInternal standard <1 ppm
RMS; external standard <3 ppm RMS
SensitivityFull scan MS: 100 fg on-column with a signal-to-noise ratio (S/N) of 150:1
SIM: 50 fg on-column with a signal-to-noise ratio (S/N) of 150:1
Dynamic Range> 5,000:1

Resources

Example Analysis Output

Image
Image
1/1
Metabolite Heatmap

Visualise relative abundance patterns of differential metabolites across samples and experimental groups.

Image
Image
1/1
Sample-level Variation

Use PCA to assess overall metabolite profile variation and group separation across samples.

Image
Image
1/1
Sample Correlation

Review correlation patterns between samples to evaluate overall data consistency and biological grouping.

Image
Image
1/1
KEGG Annotation

Summarise annotated metabolites by KEGG pathway category to support pathway-level interpretation.

Image
Image
1/1
Metabolite Volcano Plot

Highlight significantly changed metabolites based on fold change and statistical significance.

Image
Image
1/1
KEGG Enrichment Analysis

Identify enriched metabolic pathways associated with differential metabolites across comparison groups.

Image
Image
1/1
Metabolite Heatmap

Visualise relative abundance patterns of differential metabolites across samples and experimental groups.

Image
Image
1/1
Sample-level Variation

Use PCA to assess overall metabolite profile variation and group separation across samples.

Image
Image
1/1
Sample Correlation

Review correlation patterns between samples to evaluate overall data consistency and biological grouping.

Image
Image
1/1
KEGG Annotation

Summarise annotated metabolites by KEGG pathway category to support pathway-level interpretation.

Image
Image
1/1
Metabolite Volcano Plot

Highlight significantly changed metabolites based on fold change and statistical significance.

Image
Image
1/1
KEGG Enrichment Analysis

Identify enriched metabolic pathways associated with differential metabolites across comparison groups.

Image
Image
1/1
Metabolite Heatmap

Visualise relative abundance patterns of differential metabolites across samples and experimental groups.

Image
Image
1/1
Sample-level Variation

Use PCA to assess overall metabolite profile variation and group separation across samples.

Image
Image
1/1
Sample Correlation

Review correlation patterns between samples to evaluate overall data consistency and biological grouping.

Image
Image
1/1
KEGG Annotation

Summarise annotated metabolites by KEGG pathway category to support pathway-level interpretation.

Image
Image
1/1
Metabolite Volcano Plot

Highlight significantly changed metabolites based on fold change and statistical significance.

Image
Image
1/1
KEGG Enrichment Analysis

Identify enriched metabolic pathways associated with differential metabolites across comparison groups.

Image
Image
1/1
Metabolite Heatmap

Visualise relative abundance patterns of differential metabolites across samples and experimental groups.

Image
Image
1/1
Sample-level Variation

Use PCA to assess overall metabolite profile variation and group separation across samples.

Image
Image
1/1
Sample Correlation

Review correlation patterns between samples to evaluate overall data consistency and biological grouping.

Image
Image
1/1
KEGG Annotation

Summarise annotated metabolites by KEGG pathway category to support pathway-level interpretation.

Image
Image
1/1
Metabolite Volcano Plot

Highlight significantly changed metabolites based on fold change and statistical significance.

Image
Image
1/1
KEGG Enrichment Analysis

Identify enriched metabolic pathways associated with differential metabolites across comparison groups.

Webinars

From Genes to Function: Introduction to Metabolomics for Multi-Omics Study

Learn how metabolomics complements genomics and transcriptomics by providing a direct view of cellular activity. We will explore untargeted metabolomics workflows, practical applications, and key considerations for integrating metabolomics into multi-omics studies.

Learn More
(From Genes to Function: Introduction to Metabolomics for Multi-Omics Study)
From Genes to Function: Introduction to Metabolomics for Multi-Omics Study

Learn how metabolomics complements genomics and transcriptomics by providing a direct view of cellular activity. We will explore untargeted metabolomics workflows, practical applications, and key considerations for integrating metabolomics into multi-omics studies.

Learn More
(From Genes to Function: Introduction to Metabolomics for Multi-Omics Study)
From Genes to Function: Introduction to Metabolomics for Multi-Omics Study

Learn how metabolomics complements genomics and transcriptomics by providing a direct view of cellular activity. We will explore untargeted metabolomics workflows, practical applications, and key considerations for integrating metabolomics into multi-omics studies.

Learn More
(From Genes to Function: Introduction to Metabolomics for Multi-Omics Study)
From Genes to Function: Introduction to Metabolomics for Multi-Omics Study

Learn how metabolomics complements genomics and transcriptomics by providing a direct view of cellular activity. We will explore untargeted metabolomics workflows, practical applications, and key considerations for integrating metabolomics into multi-omics studies.

Learn More
(From Genes to Function: Introduction to Metabolomics for Multi-Omics Study)

Frequently Asked Questions

Why does untargeted metabolomics use both positive and negative ion modes?

Different metabolites ionise differently in mass spectrometry. Some compounds are more easily detected in positive ion mode, while others are better detected in negative ion mode. Using both modes helps improve metabolome coverage and supports broader small-molecule profiling.


Positive and negative ion mode data are usually processed separately. If combined interpretation or customised bioinformatics analysis is required, this should be discussed during project setup.


Can I compare the abundance of different metabolites within the same sample?

Why might a specific compound not be detected in untargeted metabolomics?

How many metabolites or features can untargeted metabolomics detect?

Explore Metabolomics Resources

Access webinars, brochures and case studies covering sequencing technologies, study planning and data interpretation.
View Webinar Library
(Explore Metabolomics Resources)
View Webinar Library
(Explore Metabolomics Resources)
Background
Background

Speak with a Specialist

Have a project in mind?


Send us your enquiry and a Novogene Europe specialist will be in touch.


Privacy PolicyCookie PolicyTerms