
• Cart
    • Quote
    • Enquiry
    • Cart
    • Quote
    • Enquiry
Novogene Europe
  • Novogene Europe
  • Genomics
    • Human Whole Genome Sequencing
    • Whole Exome Sequencing
    • Plant and Animal Whole Genome Sequencing
    • Plant and Animal De novo Sequencing
    • Microbial Whole Genome Sequencing
    • Microbial De novo Sequencing
    • Whole Plasmid SequencingOrder Online!
    Proteomics
    • Olink ProteomicsNew!
    Epigenomics
    • DNA Methylation SequencingUpdated!
    • Chromatin Immunoprecipitation Sequencing (ChIP-seq)
    • RNA Immunoprecipitation Sequencing (RIP-seq)
    Metabolomics
    • Untargeted MetabolomicsNew!
    Transcriptomics
    • mRNA Sequencing
    • Small RNA Sequencing (sRNA‑seq)
    • Circular RNA Sequencing (circRNA-seq)
    • Total RNA Sequencing
    • Whole Transcriptome Sequencing
    • Full-Length Transcriptome Sequencing
    • Prokaryotic RNA Sequencing
    • Metatranscriptome Sequencing
    Metagenomics
    • Amplicon SequencingOrder Online!
    • Shotgun Metagenomics Sequencing
    Single Cell & Spatial Omics
    • Single Cell Gene Expression Updated!
    • Single Cell Immune Profiling
    • 10x Visium HD Spatial Gene Expression
    Premade Library
    • Sequencing Only on Illumina® Sequencer
    • Sequencing Only on Element SequencerNew!
    • Sequencing Only on PacBio Sequencer
    Translational Research
    • Accredited & Validated Clinical Research Sequencing
  • PromotionsPromotions
    • Platforms
    • Automated Delivery Platform (Falcon)
    • Bioinformatics Analysis Tool (NovoMagic)
    • Customer Service System (CSS)
    • Customer Support
    • Webinars
    • Case Study
    • Blog
    • Brochure
    • Cancer Research
    • Immuno-oncology
    • Agrigenomics
    • Environment
    • Food Science
    • Human Microbiome
    • Plant and Animal Microbiome
    • Drug Discovery and Development
    • Rare and Complex Diseases
    • About Us
    • News & Events
    • Careers
    • Our Locations
  • Contact UsContact Us
    • Amplicon Sequencing
    • Whole Plasmid Sequencing

ServicesServices menu

ResourcesResources menu

SupportSupport menu

CompanyCompany menu

Services
Human Whole Genome SequencingWhole Exome SequencingPlant and Animal Whole Genome SequencingPlant and Animal De novo SequencingDNA Methylation Sequencing & Profiling ServicesmRNA SequencingFull-Length Transcriptome SequencingWhole Transcriptome SequencingMetatranscriptome SequencingShotgun Metagenomics SequencingAmplicon SequencingWhole Plasmid SequencingSingle Cell Gene ExpressionSingle Cell Immune Profiling10X Visium HD Spatial Gene ExpressionOlink ProteomicsUntargeted MetabolomicsAccredited & Validated Clinical Research Sequencing
Resources
WebinarsCase StudyBlogBrochure
Support
PlatformBioinformatics Analysis Tool (NovoMagic)Customer Service System (CSS)Customer Support
Company
About UsNews & EventsLocationContact Us
LinkedInLinkedIn hoverYouTubeYouTube hoverInstagramInstagram hoverXX hover
Copyright © 2026 Novogene Inc. All rights reserved.For Research Use Only. Not for Clinical Diagnostic Use.
    • Cart
    • Quote
    • Enquiry
    • Cart
    • Quote
    • Enquiry
Novogene Europe
  • Novogene Europe
  • Genomics
    • Human Whole Genome Sequencing
    • Whole Exome Sequencing
    • Plant and Animal Whole Genome Sequencing
    • Plant and Animal De novo Sequencing
    • Microbial Whole Genome Sequencing
    • Microbial De novo Sequencing
    • Whole Plasmid SequencingOrder Online!
    Proteomics
    • Olink ProteomicsNew!
    Epigenomics
    • DNA Methylation SequencingUpdated!
    • Chromatin Immunoprecipitation Sequencing (ChIP-seq)
    • RNA Immunoprecipitation Sequencing (RIP-seq)
    Metabolomics
    • Untargeted MetabolomicsNew!
    Transcriptomics
    • mRNA Sequencing
    • Small RNA Sequencing (sRNA‑seq)
    • Circular RNA Sequencing (circRNA-seq)
    • Total RNA Sequencing
    • Whole Transcriptome Sequencing
    • Full-Length Transcriptome Sequencing
    • Prokaryotic RNA Sequencing
    • Metatranscriptome Sequencing
    Metagenomics
    • Amplicon SequencingOrder Online!
    • Shotgun Metagenomics Sequencing
    Single Cell & Spatial Omics
    • Single Cell Gene Expression Updated!
    • Single Cell Immune Profiling
    • 10x Visium HD Spatial Gene Expression
    Premade Library
    • Sequencing Only on Illumina® Sequencer
    • Sequencing Only on Element SequencerNew!
    • Sequencing Only on PacBio Sequencer
    Translational Research
    • Accredited & Validated Clinical Research Sequencing
  • PromotionsPromotions
    • Platforms
    • Automated Delivery Platform (Falcon)
    • Bioinformatics Analysis Tool (NovoMagic)
    • Customer Service System (CSS)
    • Customer Support
    • Webinars
    • Case Study
    • Blog
    • Brochure
    • Cancer Research
    • Immuno-oncology
    • Agrigenomics
    • Environment
    • Food Science
    • Human Microbiome
    • Plant and Animal Microbiome
    • Drug Discovery and Development
    • Rare and Complex Diseases
    • About Us
    • News & Events
    • Careers
    • Our Locations
  • Contact UsContact Us
    • Amplicon Sequencing
    • Whole Plasmid Sequencing

ServicesServices menu

ResourcesResources menu

SupportSupport menu

CompanyCompany menu

Services
Human Whole Genome SequencingWhole Exome SequencingPlant and Animal Whole Genome SequencingPlant and Animal De novo SequencingDNA Methylation Sequencing & Profiling ServicesmRNA SequencingFull-Length Transcriptome SequencingWhole Transcriptome SequencingMetatranscriptome SequencingShotgun Metagenomics SequencingAmplicon SequencingWhole Plasmid SequencingSingle Cell Gene ExpressionSingle Cell Immune Profiling10X Visium HD Spatial Gene ExpressionOlink ProteomicsUntargeted MetabolomicsAccredited & Validated Clinical Research Sequencing
Resources
WebinarsCase StudyBlogBrochure
Support
PlatformBioinformatics Analysis Tool (NovoMagic)Customer Service System (CSS)Customer Support
Company
About UsNews & EventsLocationContact Us
LinkedInLinkedIn hoverYouTubeYouTube hoverInstagramInstagram hoverXX hover
Copyright © 2026 Novogene Inc. All rights reserved.For Research Use Only. Not for Clinical Diagnostic Use.
banner laptop bg
banner mobile bg

Single-cell Gene Expression

High-resolution single-cell and single-nucleus transcriptome profiling to explore cellular heterogeneity, cell states and gene expression dynamics.
OverviewOverview
3′ Gene Expression3′ Gene Expression
5′ Gene Expression5′ Gene Expression
Flex Gene ExpressionFlex Gene Expression
SpecificationsSpecifications
ResourcesResources

Single-cell RNA sequencing (scRNA-seq) enables researchers to investigate gene expression at the level of individual cells, revealing cellular heterogeneity, identifying distinct cell populations and exploring transcriptional changes that may be masked in bulk RNA sequencing. It provides valuable insights into cell identity, developmental processes, cellular responses and the molecular mechanisms underlying complex biological systems.


Novogene Europe offers single-cell and single-nucleus gene expression profiling using 10x Genomics Chromium technologies, supporting research across human, animal and plant systems. Our portfolio includes 3′ and 5′ gene expression workflows, alongside probe-based Flex Gene Expression for fixed cells, nuclei and FFPE samples. Together, these complementary approaches provide flexibility across sample types, experimental designs and research objectives.


With access to a broad range of sequencing and bioinformatics capabilities, Novogene Europe supports researchers throughout their single-cell projects, from experimental planning and workflow selection to data analysis and interpretation. Applications span oncology, immunology, neuroscience, developmental biology and plant research, including investigations of cellular diversity, tissue responses and complex biological processes.

3′ Gene Expression

Transcriptome-wide profiling across diverse biological systems

Profile gene expression in individual cells or nuclei to characterise cellular heterogeneity, identify cell populations and investigate transcriptional responses across human, animal and plant research.

Key highlights

Cellular heterogeneity: Identify and characterise distinct cell populations.
Gene expression: Explore cell-specific transcriptional profiles and responses.
Broad sample applications: Support diverse tissues and biological systems, including plant protoplasts and nuclei.
Preview
Transcriptome-wide profiling across diverse biological systems

Profile gene expression in individual cells or nuclei to characterise cellular heterogeneity, identify cell populations and investigate transcriptional responses across human, animal and plant research.

Key highlights

Cellular heterogeneity: Identify and characterise distinct cell populations.
Gene expression: Explore cell-specific transcriptional profiles and responses.
Broad sample applications: Support diverse tissues and biological systems, including plant protoplasts and nuclei.
Preview

3′ Gene Expression

Transcriptome-wide profiling across diverse biological systems

Profile gene expression in individual cells or nuclei to characterise cellular heterogeneity, identify cell populations and investigate transcriptional responses across human, animal and plant research.

Key highlights

Cellular heterogeneity: Identify and characterise distinct cell populations.
Gene expression: Explore cell-specific transcriptional profiles and responses.
Broad sample applications: Support diverse tissues and biological systems, including plant protoplasts and nuclei.
Preview
Transcriptome-wide profiling across diverse biological systems

Profile gene expression in individual cells or nuclei to characterise cellular heterogeneity, identify cell populations and investigate transcriptional responses across human, animal and plant research.

Key highlights

Cellular heterogeneity: Identify and characterise distinct cell populations.
Gene expression: Explore cell-specific transcriptional profiles and responses.
Broad sample applications: Support diverse tissues and biological systems, including plant protoplasts and nuclei.
Preview

5′ Gene Expression

Connect gene expression with immune repertoire profiling

Characterise cellular transcriptional states with the option to integrate T-cell and B-cell receptor profiling through dedicated V(D)J workflows, supporting deeper investigation of immune cell diversity and function.

Key highlights

Immune cell profiling: Characterise immune cell populations and transcriptional states.
TCR & BCR analysis: Explore receptor diversity and clonal relationships.
Integrated insights: Link immune receptor information with gene expression profiles.
Preview
Connect gene expression with immune repertoire profiling

Characterise cellular transcriptional states with the option to integrate T-cell and B-cell receptor profiling through dedicated V(D)J workflows, supporting deeper investigation of immune cell diversity and function.

Key highlights

Immune cell profiling: Characterise immune cell populations and transcriptional states.
TCR & BCR analysis: Explore receptor diversity and clonal relationships.
Integrated insights: Link immune receptor information with gene expression profiles.
Preview

5′ Gene Expression

Connect gene expression with immune repertoire profiling

Characterise cellular transcriptional states with the option to integrate T-cell and B-cell receptor profiling through dedicated V(D)J workflows, supporting deeper investigation of immune cell diversity and function.

Key highlights

Immune cell profiling: Characterise immune cell populations and transcriptional states.
TCR & BCR analysis: Explore receptor diversity and clonal relationships.
Integrated insights: Link immune receptor information with gene expression profiles.
Preview
Connect gene expression with immune repertoire profiling

Characterise cellular transcriptional states with the option to integrate T-cell and B-cell receptor profiling through dedicated V(D)J workflows, supporting deeper investigation of immune cell diversity and function.

Key highlights

Immune cell profiling: Characterise immune cell populations and transcriptional states.
TCR & BCR analysis: Explore receptor diversity and clonal relationships.
Integrated insights: Link immune receptor information with gene expression profiles.
Preview

Flex Gene Expression

Probe-based profiling for fixed and FFPE samples

Profile gene expression in fixed cells, nuclei and FFPE samples using 10x Genomics GEM-X Flex v2 (Apex). The workflow supports flexible sample collection, preservation and multiplexing for scalable single-cell studies.

Key highlights

Sample compatibility: Fixed cells, nuclei and FFPE tissue.
Flexible multiplexing: Up to 24 samples per run.
Scalable study design: Support large-cohort, longitudinal and multi-site studies.
Preview
Probe-based profiling for fixed and FFPE samples

Profile gene expression in fixed cells, nuclei and FFPE samples using 10x Genomics GEM-X Flex v2 (Apex). The workflow supports flexible sample collection, preservation and multiplexing for scalable single-cell studies.

Key highlights

Sample compatibility: Fixed cells, nuclei and FFPE tissue.
Flexible multiplexing: Up to 24 samples per run.
Scalable study design: Support large-cohort, longitudinal and multi-site studies.
Preview

Flex Gene Expression

Probe-based profiling for fixed and FFPE samples

Profile gene expression in fixed cells, nuclei and FFPE samples using 10x Genomics GEM-X Flex v2 (Apex). The workflow supports flexible sample collection, preservation and multiplexing for scalable single-cell studies.

Key highlights

Sample compatibility: Fixed cells, nuclei and FFPE tissue.
Flexible multiplexing: Up to 24 samples per run.
Scalable study design: Support large-cohort, longitudinal and multi-site studies.
Preview
Probe-based profiling for fixed and FFPE samples

Profile gene expression in fixed cells, nuclei and FFPE samples using 10x Genomics GEM-X Flex v2 (Apex). The workflow supports flexible sample collection, preservation and multiplexing for scalable single-cell studies.

Key highlights

Sample compatibility: Fixed cells, nuclei and FFPE tissue.
Flexible multiplexing: Up to 24 samples per run.
Scalable study design: Support large-cohort, longitudinal and multi-site studies.
Preview

Specifications

Sample Requirements

The quantities listed are provided for reference only. Please download the Sample Requirements for detailed guidance, or Contact us to discuss your project-specific requirements.

ServiceAssaySample Type**Recommended AmountOther details
scRNA-seq3’ GEXCryopreserved cell suspension2-3 M cells
Cell viability > 70%
• Samples should be cryopreserved
with freezing media.
• Shipped in cryovials with dry ice.
Fresh
tissues/organoids
> 50 mg• Novogene will ship tissue storage
solution.
• Tissues must be placed in tissue
storage solution immediately after retrieval
and arrive in the lab within 48 hours.
• Shipped with ice packs.
Whole blood/Bone
marrow
(Mouse, Human, Rat)
2-4 mL
• Collected in EDTA vacutainer tubes.
• Shipped with ice packs.
snRNA-seq3’ GEXFresh frozen human/animal tissue or organoids> 50 mg• Shipped in cryovials with dry ice.
Fresh frozen plant tissue> 200 mg
sc/snRNA-seq10x Flex Gene Expression v2 (Apex)Fixed cell/nuclei suspension (Mouse, Human)≥ 500K fixed cells/sample
(minimum 320K cells/sample)
Sample viability ≥80% before fixation
• Cell dimeter: 5~30 μm
• Only stored at -80℃ up to 12months
• Provide ≥70μl Conc. • Quenching Buffer B per fixed sample
• Fix the cell/nuclei suspension following the 10x Genomics CG000782 Rev D protocol.
FFPE block (Mouse, Human)1 FFPE block
Tissue thickness > 1mm
• DV200 ≥ 30%
• After tissue dissociation, the nuclear count should ≥ 300K
FFPE section (Mouse, Human)Sample QC: 5-6 FFPE(5μm thickness) scrolls
Main experiment: 5-10 FFPE(10μm thickness) tissue rolls
• DV200 ≥ 30%
• After tissue dissociation, the nuclear count should ≥ 300K
*Contact us for species-specific recommendations and tissue type guidance.
**Sample type preferences may vary based on sequencing requirements and sample compatibility.

Sample Requirements

The quantities listed are provided for reference only. Please download the Sample Requirements for detailed guidance, or Contact us to discuss your project-specific requirements.

ServiceAssaySample Type**Recommended AmountOther details
scRNA-seq3’ GEXCryopreserved cell suspension2-3 M cells
Cell viability > 70%
• Samples should be cryopreserved
with freezing media.
• Shipped in cryovials with dry ice.
Fresh
tissues/organoids
> 50 mg• Novogene will ship tissue storage
solution.
• Tissues must be placed in tissue
storage solution immediately after retrieval
and arrive in the lab within 48 hours.
• Shipped with ice packs.
Whole blood/Bone
marrow
(Mouse, Human, Rat)
2-4 mL
• Collected in EDTA vacutainer tubes.
• Shipped with ice packs.
snRNA-seq3’ GEXFresh frozen human/animal tissue or organoids> 50 mg• Shipped in cryovials with dry ice.
Fresh frozen plant tissue> 200 mg
sc/snRNA-seq10x Flex Gene Expression v2 (Apex)Fixed cell/nuclei suspension (Mouse, Human)≥ 500K fixed cells/sample
(minimum 320K cells/sample)
Sample viability ≥80% before fixation
• Cell dimeter: 5~30 μm
• Only stored at -80℃ up to 12months
• Provide ≥70μl Conc. • Quenching Buffer B per fixed sample
• Fix the cell/nuclei suspension following the 10x Genomics CG000782 Rev D protocol.
FFPE block (Mouse, Human)1 FFPE block
Tissue thickness > 1mm
• DV200 ≥ 30%
• After tissue dissociation, the nuclear count should ≥ 300K
FFPE section (Mouse, Human)Sample QC: 5-6 FFPE(5μm thickness) scrolls
Main experiment: 5-10 FFPE(10μm thickness) tissue rolls
• DV200 ≥ 30%
• After tissue dissociation, the nuclear count should ≥ 300K
*Contact us for species-specific recommendations and tissue type guidance.
**Sample type preferences may vary based on sequencing requirements and sample compatibility.

Sample Requirements

The quantities listed are provided for reference only. Please download the Sample Requirements for detailed guidance, or Contact us to discuss your project-specific requirements.

ServiceAssaySample Type**Recommended AmountOther details
scRNA-seq3’ GEXCryopreserved cell suspension2-3 M cells
Cell viability > 70%
• Samples should be cryopreserved
with freezing media.
• Shipped in cryovials with dry ice.
Fresh
tissues/organoids
> 50 mg• Novogene will ship tissue storage
solution.
• Tissues must be placed in tissue
storage solution immediately after retrieval
and arrive in the lab within 48 hours.
• Shipped with ice packs.
Whole blood/Bone
marrow
(Mouse, Human, Rat)
2-4 mL
• Collected in EDTA vacutainer tubes.
• Shipped with ice packs.
snRNA-seq3’ GEXFresh frozen human/animal tissue or organoids> 50 mg• Shipped in cryovials with dry ice.
Fresh frozen plant tissue> 200 mg
sc/snRNA-seq10x Flex Gene Expression v2 (Apex)Fixed cell/nuclei suspension (Mouse, Human)≥ 500K fixed cells/sample
(minimum 320K cells/sample)
Sample viability ≥80% before fixation
• Cell dimeter: 5~30 μm
• Only stored at -80℃ up to 12months
• Provide ≥70μl Conc. • Quenching Buffer B per fixed sample
• Fix the cell/nuclei suspension following the 10x Genomics CG000782 Rev D protocol.
FFPE block (Mouse, Human)1 FFPE block
Tissue thickness > 1mm
• DV200 ≥ 30%
• After tissue dissociation, the nuclear count should ≥ 300K
FFPE section (Mouse, Human)Sample QC: 5-6 FFPE(5μm thickness) scrolls
Main experiment: 5-10 FFPE(10μm thickness) tissue rolls
• DV200 ≥ 30%
• After tissue dissociation, the nuclear count should ≥ 300K
*Contact us for species-specific recommendations and tissue type guidance.
**Sample type preferences may vary based on sequencing requirements and sample compatibility.

Sample Requirements

The quantities listed are provided for reference only. Please download the Sample Requirements for detailed guidance, or Contact us to discuss your project-specific requirements.

ServiceAssaySample Type**Recommended AmountOther details
scRNA-seq3’ GEXCryopreserved cell suspension2-3 M cells
Cell viability > 70%
• Samples should be cryopreserved
with freezing media.
• Shipped in cryovials with dry ice.
Fresh
tissues/organoids
> 50 mg• Novogene will ship tissue storage
solution.
• Tissues must be placed in tissue
storage solution immediately after retrieval
and arrive in the lab within 48 hours.
• Shipped with ice packs.
Whole blood/Bone
marrow
(Mouse, Human, Rat)
2-4 mL
• Collected in EDTA vacutainer tubes.
• Shipped with ice packs.
snRNA-seq3’ GEXFresh frozen human/animal tissue or organoids> 50 mg• Shipped in cryovials with dry ice.
Fresh frozen plant tissue> 200 mg
sc/snRNA-seq10x Flex Gene Expression v2 (Apex)Fixed cell/nuclei suspension (Mouse, Human)≥ 500K fixed cells/sample
(minimum 320K cells/sample)
Sample viability ≥80% before fixation
• Cell dimeter: 5~30 μm
• Only stored at -80℃ up to 12months
• Provide ≥70μl Conc. • Quenching Buffer B per fixed sample
• Fix the cell/nuclei suspension following the 10x Genomics CG000782 Rev D protocol.
FFPE block (Mouse, Human)1 FFPE block
Tissue thickness > 1mm
• DV200 ≥ 30%
• After tissue dissociation, the nuclear count should ≥ 300K
FFPE section (Mouse, Human)Sample QC: 5-6 FFPE(5μm thickness) scrolls
Main experiment: 5-10 FFPE(10μm thickness) tissue rolls
• DV200 ≥ 30%
• After tissue dissociation, the nuclear count should ≥ 300K
*Contact us for species-specific recommendations and tissue type guidance.
**Sample type preferences may vary based on sequencing requirements and sample compatibility.

Sequencing and Analysis

Recommended data outputs and analysis examples are provided for reference only. For detailed information, please  contact us to discuss your project-specific analysis requirements.

Sequencing PlatformIllumina NovaSeq X-Plus Sequencing Platform
Read LengthPaired-end 150 bp
Recommended Data3' & 5' GEX assay: 20,000 - 50,000 read pairs/cell, around 120Gb/sample
Flex Apex assay: 10,000 - 20,000 reads per recovered cell, corresponding to approximately 30 - 60 Gb/sample.
AnalysisCell Ranger AnalysisStandard Analysis
Demultiplex BCL files from a sequencer into FASTQs.
Summary metrics (sequencing quality, number of cells detected, the mean reads per cell, and the median genes detected per cell et al.).
Alignment of reads to genome.
Gene expression quantification.
Clustering analysis.
Differentially expression analysis between clusters.
Visualization.
Demultiplex BCL files from a sequencer into FASTQs.
Alignment, UMI counting, Metrics summary.
Identification of highly variable gene (HVGs).
Cell Subpopulation Identification.
Principal component analysis (PCA).
Identify clusters of cells.
Dimensionality reduction and Visualization.
Marker gene detection (Differentially expression analysis between clusters).
GO/KEGG/Reactome Enrichment.
FunctionalAnnotation of Transcription Factor.
Protein-Protein Interaction Network Analysis.

Sequencing and Analysis

Recommended data outputs and analysis examples are provided for reference only. For detailed information, please  contact us to discuss your project-specific analysis requirements.

Sequencing PlatformIllumina NovaSeq X-Plus Sequencing Platform
Read LengthPaired-end 150 bp
Recommended Data3' & 5' GEX assay: 20,000 - 50,000 read pairs/cell, around 120Gb/sample
Flex Apex assay: 10,000 - 20,000 reads per recovered cell, corresponding to approximately 30 - 60 Gb/sample.
AnalysisCell Ranger AnalysisStandard Analysis
Demultiplex BCL files from a sequencer into FASTQs.
Summary metrics (sequencing quality, number of cells detected, the mean reads per cell, and the median genes detected per cell et al.).
Alignment of reads to genome.
Gene expression quantification.
Clustering analysis.
Differentially expression analysis between clusters.
Visualization.
Demultiplex BCL files from a sequencer into FASTQs.
Alignment, UMI counting, Metrics summary.
Identification of highly variable gene (HVGs).
Cell Subpopulation Identification.
Principal component analysis (PCA).
Identify clusters of cells.
Dimensionality reduction and Visualization.
Marker gene detection (Differentially expression analysis between clusters).
GO/KEGG/Reactome Enrichment.
FunctionalAnnotation of Transcription Factor.
Protein-Protein Interaction Network Analysis.

Sequencing and Analysis

Recommended data outputs and analysis examples are provided for reference only. For detailed information, please  contact us to discuss your project-specific analysis requirements.

Sequencing PlatformIllumina NovaSeq X-Plus Sequencing Platform
Read LengthPaired-end 150 bp
Recommended Data3' & 5' GEX assay: 20,000 - 50,000 read pairs/cell, around 120Gb/sample
Flex Apex assay: 10,000 - 20,000 reads per recovered cell, corresponding to approximately 30 - 60 Gb/sample.
AnalysisCell Ranger AnalysisStandard Analysis
Demultiplex BCL files from a sequencer into FASTQs.
Summary metrics (sequencing quality, number of cells detected, the mean reads per cell, and the median genes detected per cell et al.).
Alignment of reads to genome.
Gene expression quantification.
Clustering analysis.
Differentially expression analysis between clusters.
Visualization.
Demultiplex BCL files from a sequencer into FASTQs.
Alignment, UMI counting, Metrics summary.
Identification of highly variable gene (HVGs).
Cell Subpopulation Identification.
Principal component analysis (PCA).
Identify clusters of cells.
Dimensionality reduction and Visualization.
Marker gene detection (Differentially expression analysis between clusters).
GO/KEGG/Reactome Enrichment.
FunctionalAnnotation of Transcription Factor.
Protein-Protein Interaction Network Analysis.

Sequencing and Analysis

Recommended data outputs and analysis examples are provided for reference only. For detailed information, please  contact us to discuss your project-specific analysis requirements.

Sequencing PlatformIllumina NovaSeq X-Plus Sequencing Platform
Read LengthPaired-end 150 bp
Recommended Data3' & 5' GEX assay: 20,000 - 50,000 read pairs/cell, around 120Gb/sample
Flex Apex assay: 10,000 - 20,000 reads per recovered cell, corresponding to approximately 30 - 60 Gb/sample.
AnalysisCell Ranger AnalysisStandard Analysis
Demultiplex BCL files from a sequencer into FASTQs.
Summary metrics (sequencing quality, number of cells detected, the mean reads per cell, and the median genes detected per cell et al.).
Alignment of reads to genome.
Gene expression quantification.
Clustering analysis.
Differentially expression analysis between clusters.
Visualization.
Demultiplex BCL files from a sequencer into FASTQs.
Alignment, UMI counting, Metrics summary.
Identification of highly variable gene (HVGs).
Cell Subpopulation Identification.
Principal component analysis (PCA).
Identify clusters of cells.
Dimensionality reduction and Visualization.
Marker gene detection (Differentially expression analysis between clusters).
GO/KEGG/Reactome Enrichment.
FunctionalAnnotation of Transcription Factor.
Protein-Protein Interaction Network Analysis.

Specifications

Sample Requirements

The quantities listed are provided for reference only. Please download the Sample Requirements for detailed guidance, or Contact us to discuss your project-specific requirements.

ServiceAssaySample Type**Recommended AmountOther details
scRNA-seq3’ GEXCryopreserved cell suspension2-3 M cells
Cell viability > 70%
• Samples should be cryopreserved
with freezing media.
• Shipped in cryovials with dry ice.
Fresh
tissues/organoids
> 50 mg• Novogene will ship tissue storage
solution.
• Tissues must be placed in tissue
storage solution immediately after retrieval
and arrive in the lab within 48 hours.
• Shipped with ice packs.
Whole blood/Bone
marrow
(Mouse, Human, Rat)
2-4 mL
• Collected in EDTA vacutainer tubes.
• Shipped with ice packs.
snRNA-seq3’ GEXFresh frozen human/animal tissue or organoids> 50 mg• Shipped in cryovials with dry ice.
Fresh frozen plant tissue> 200 mg
sc/snRNA-seq10x Flex Gene Expression v2 (Apex)Fixed cell/nuclei suspension (Mouse, Human)≥ 500K fixed cells/sample
(minimum 320K cells/sample)
Sample viability ≥80% before fixation
• Cell dimeter: 5~30 μm
• Only stored at -80℃ up to 12months
• Provide ≥70μl Conc. • Quenching Buffer B per fixed sample
• Fix the cell/nuclei suspension following the 10x Genomics CG000782 Rev D protocol.
FFPE block (Mouse, Human)1 FFPE block
Tissue thickness > 1mm
• DV200 ≥ 30%
• After tissue dissociation, the nuclear count should ≥ 300K
FFPE section (Mouse, Human)Sample QC: 5-6 FFPE(5μm thickness) scrolls
Main experiment: 5-10 FFPE(10μm thickness) tissue rolls
• DV200 ≥ 30%
• After tissue dissociation, the nuclear count should ≥ 300K
*Contact us for species-specific recommendations and tissue type guidance.
**Sample type preferences may vary based on sequencing requirements and sample compatibility.

Sample Requirements

The quantities listed are provided for reference only. Please download the Sample Requirements for detailed guidance, or Contact us to discuss your project-specific requirements.

ServiceAssaySample Type**Recommended AmountOther details
scRNA-seq3’ GEXCryopreserved cell suspension2-3 M cells
Cell viability > 70%
• Samples should be cryopreserved
with freezing media.
• Shipped in cryovials with dry ice.
Fresh
tissues/organoids
> 50 mg• Novogene will ship tissue storage
solution.
• Tissues must be placed in tissue
storage solution immediately after retrieval
and arrive in the lab within 48 hours.
• Shipped with ice packs.
Whole blood/Bone
marrow
(Mouse, Human, Rat)
2-4 mL
• Collected in EDTA vacutainer tubes.
• Shipped with ice packs.
snRNA-seq3’ GEXFresh frozen human/animal tissue or organoids> 50 mg• Shipped in cryovials with dry ice.
Fresh frozen plant tissue> 200 mg
sc/snRNA-seq10x Flex Gene Expression v2 (Apex)Fixed cell/nuclei suspension (Mouse, Human)≥ 500K fixed cells/sample
(minimum 320K cells/sample)
Sample viability ≥80% before fixation
• Cell dimeter: 5~30 μm
• Only stored at -80℃ up to 12months
• Provide ≥70μl Conc. • Quenching Buffer B per fixed sample
• Fix the cell/nuclei suspension following the 10x Genomics CG000782 Rev D protocol.
FFPE block (Mouse, Human)1 FFPE block
Tissue thickness > 1mm
• DV200 ≥ 30%
• After tissue dissociation, the nuclear count should ≥ 300K
FFPE section (Mouse, Human)Sample QC: 5-6 FFPE(5μm thickness) scrolls
Main experiment: 5-10 FFPE(10μm thickness) tissue rolls
• DV200 ≥ 30%
• After tissue dissociation, the nuclear count should ≥ 300K
*Contact us for species-specific recommendations and tissue type guidance.
**Sample type preferences may vary based on sequencing requirements and sample compatibility.

Sample Requirements

The quantities listed are provided for reference only. Please download the Sample Requirements for detailed guidance, or Contact us to discuss your project-specific requirements.

ServiceAssaySample Type**Recommended AmountOther details
scRNA-seq3’ GEXCryopreserved cell suspension2-3 M cells
Cell viability > 70%
• Samples should be cryopreserved
with freezing media.
• Shipped in cryovials with dry ice.
Fresh
tissues/organoids
> 50 mg• Novogene will ship tissue storage
solution.
• Tissues must be placed in tissue
storage solution immediately after retrieval
and arrive in the lab within 48 hours.
• Shipped with ice packs.
Whole blood/Bone
marrow
(Mouse, Human, Rat)
2-4 mL
• Collected in EDTA vacutainer tubes.
• Shipped with ice packs.
snRNA-seq3’ GEXFresh frozen human/animal tissue or organoids> 50 mg• Shipped in cryovials with dry ice.
Fresh frozen plant tissue> 200 mg
sc/snRNA-seq10x Flex Gene Expression v2 (Apex)Fixed cell/nuclei suspension (Mouse, Human)≥ 500K fixed cells/sample
(minimum 320K cells/sample)
Sample viability ≥80% before fixation
• Cell dimeter: 5~30 μm
• Only stored at -80℃ up to 12months
• Provide ≥70μl Conc. • Quenching Buffer B per fixed sample
• Fix the cell/nuclei suspension following the 10x Genomics CG000782 Rev D protocol.
FFPE block (Mouse, Human)1 FFPE block
Tissue thickness > 1mm
• DV200 ≥ 30%
• After tissue dissociation, the nuclear count should ≥ 300K
FFPE section (Mouse, Human)Sample QC: 5-6 FFPE(5μm thickness) scrolls
Main experiment: 5-10 FFPE(10μm thickness) tissue rolls
• DV200 ≥ 30%
• After tissue dissociation, the nuclear count should ≥ 300K
*Contact us for species-specific recommendations and tissue type guidance.
**Sample type preferences may vary based on sequencing requirements and sample compatibility.

Sample Requirements

The quantities listed are provided for reference only. Please download the Sample Requirements for detailed guidance, or Contact us to discuss your project-specific requirements.

ServiceAssaySample Type**Recommended AmountOther details
scRNA-seq3’ GEXCryopreserved cell suspension2-3 M cells
Cell viability > 70%
• Samples should be cryopreserved
with freezing media.
• Shipped in cryovials with dry ice.
Fresh
tissues/organoids
> 50 mg• Novogene will ship tissue storage
solution.
• Tissues must be placed in tissue
storage solution immediately after retrieval
and arrive in the lab within 48 hours.
• Shipped with ice packs.
Whole blood/Bone
marrow
(Mouse, Human, Rat)
2-4 mL
• Collected in EDTA vacutainer tubes.
• Shipped with ice packs.
snRNA-seq3’ GEXFresh frozen human/animal tissue or organoids> 50 mg• Shipped in cryovials with dry ice.
Fresh frozen plant tissue> 200 mg
sc/snRNA-seq10x Flex Gene Expression v2 (Apex)Fixed cell/nuclei suspension (Mouse, Human)≥ 500K fixed cells/sample
(minimum 320K cells/sample)
Sample viability ≥80% before fixation
• Cell dimeter: 5~30 μm
• Only stored at -80℃ up to 12months
• Provide ≥70μl Conc. • Quenching Buffer B per fixed sample
• Fix the cell/nuclei suspension following the 10x Genomics CG000782 Rev D protocol.
FFPE block (Mouse, Human)1 FFPE block
Tissue thickness > 1mm
• DV200 ≥ 30%
• After tissue dissociation, the nuclear count should ≥ 300K
FFPE section (Mouse, Human)Sample QC: 5-6 FFPE(5μm thickness) scrolls
Main experiment: 5-10 FFPE(10μm thickness) tissue rolls
• DV200 ≥ 30%
• After tissue dissociation, the nuclear count should ≥ 300K
*Contact us for species-specific recommendations and tissue type guidance.
**Sample type preferences may vary based on sequencing requirements and sample compatibility.

Sequencing and Analysis

Recommended data outputs and analysis examples are provided for reference only. For detailed information, please  contact us to discuss your project-specific analysis requirements.

Sequencing PlatformIllumina NovaSeq X-Plus Sequencing Platform
Read LengthPaired-end 150 bp
Recommended Data3' & 5' GEX assay: 20,000 - 50,000 read pairs/cell, around 120Gb/sample
Flex Apex assay: 10,000 - 20,000 reads per recovered cell, corresponding to approximately 30 - 60 Gb/sample.
AnalysisCell Ranger AnalysisStandard Analysis
Demultiplex BCL files from a sequencer into FASTQs.
Summary metrics (sequencing quality, number of cells detected, the mean reads per cell, and the median genes detected per cell et al.).
Alignment of reads to genome.
Gene expression quantification.
Clustering analysis.
Differentially expression analysis between clusters.
Visualization.
Demultiplex BCL files from a sequencer into FASTQs.
Alignment, UMI counting, Metrics summary.
Identification of highly variable gene (HVGs).
Cell Subpopulation Identification.
Principal component analysis (PCA).
Identify clusters of cells.
Dimensionality reduction and Visualization.
Marker gene detection (Differentially expression analysis between clusters).
GO/KEGG/Reactome Enrichment.
FunctionalAnnotation of Transcription Factor.
Protein-Protein Interaction Network Analysis.

Sequencing and Analysis

Recommended data outputs and analysis examples are provided for reference only. For detailed information, please  contact us to discuss your project-specific analysis requirements.

Sequencing PlatformIllumina NovaSeq X-Plus Sequencing Platform
Read LengthPaired-end 150 bp
Recommended Data3' & 5' GEX assay: 20,000 - 50,000 read pairs/cell, around 120Gb/sample
Flex Apex assay: 10,000 - 20,000 reads per recovered cell, corresponding to approximately 30 - 60 Gb/sample.
AnalysisCell Ranger AnalysisStandard Analysis
Demultiplex BCL files from a sequencer into FASTQs.
Summary metrics (sequencing quality, number of cells detected, the mean reads per cell, and the median genes detected per cell et al.).
Alignment of reads to genome.
Gene expression quantification.
Clustering analysis.
Differentially expression analysis between clusters.
Visualization.
Demultiplex BCL files from a sequencer into FASTQs.
Alignment, UMI counting, Metrics summary.
Identification of highly variable gene (HVGs).
Cell Subpopulation Identification.
Principal component analysis (PCA).
Identify clusters of cells.
Dimensionality reduction and Visualization.
Marker gene detection (Differentially expression analysis between clusters).
GO/KEGG/Reactome Enrichment.
FunctionalAnnotation of Transcription Factor.
Protein-Protein Interaction Network Analysis.

Sequencing and Analysis

Recommended data outputs and analysis examples are provided for reference only. For detailed information, please  contact us to discuss your project-specific analysis requirements.

Sequencing PlatformIllumina NovaSeq X-Plus Sequencing Platform
Read LengthPaired-end 150 bp
Recommended Data3' & 5' GEX assay: 20,000 - 50,000 read pairs/cell, around 120Gb/sample
Flex Apex assay: 10,000 - 20,000 reads per recovered cell, corresponding to approximately 30 - 60 Gb/sample.
AnalysisCell Ranger AnalysisStandard Analysis
Demultiplex BCL files from a sequencer into FASTQs.
Summary metrics (sequencing quality, number of cells detected, the mean reads per cell, and the median genes detected per cell et al.).
Alignment of reads to genome.
Gene expression quantification.
Clustering analysis.
Differentially expression analysis between clusters.
Visualization.
Demultiplex BCL files from a sequencer into FASTQs.
Alignment, UMI counting, Metrics summary.
Identification of highly variable gene (HVGs).
Cell Subpopulation Identification.
Principal component analysis (PCA).
Identify clusters of cells.
Dimensionality reduction and Visualization.
Marker gene detection (Differentially expression analysis between clusters).
GO/KEGG/Reactome Enrichment.
FunctionalAnnotation of Transcription Factor.
Protein-Protein Interaction Network Analysis.

Sequencing and Analysis

Recommended data outputs and analysis examples are provided for reference only. For detailed information, please  contact us to discuss your project-specific analysis requirements.

Sequencing PlatformIllumina NovaSeq X-Plus Sequencing Platform
Read LengthPaired-end 150 bp
Recommended Data3' & 5' GEX assay: 20,000 - 50,000 read pairs/cell, around 120Gb/sample
Flex Apex assay: 10,000 - 20,000 reads per recovered cell, corresponding to approximately 30 - 60 Gb/sample.
AnalysisCell Ranger AnalysisStandard Analysis
Demultiplex BCL files from a sequencer into FASTQs.
Summary metrics (sequencing quality, number of cells detected, the mean reads per cell, and the median genes detected per cell et al.).
Alignment of reads to genome.
Gene expression quantification.
Clustering analysis.
Differentially expression analysis between clusters.
Visualization.
Demultiplex BCL files from a sequencer into FASTQs.
Alignment, UMI counting, Metrics summary.
Identification of highly variable gene (HVGs).
Cell Subpopulation Identification.
Principal component analysis (PCA).
Identify clusters of cells.
Dimensionality reduction and Visualization.
Marker gene detection (Differentially expression analysis between clusters).
GO/KEGG/Reactome Enrichment.
FunctionalAnnotation of Transcription Factor.
Protein-Protein Interaction Network Analysis.

Resources

Example Analysis Output

Image
Image
1/1
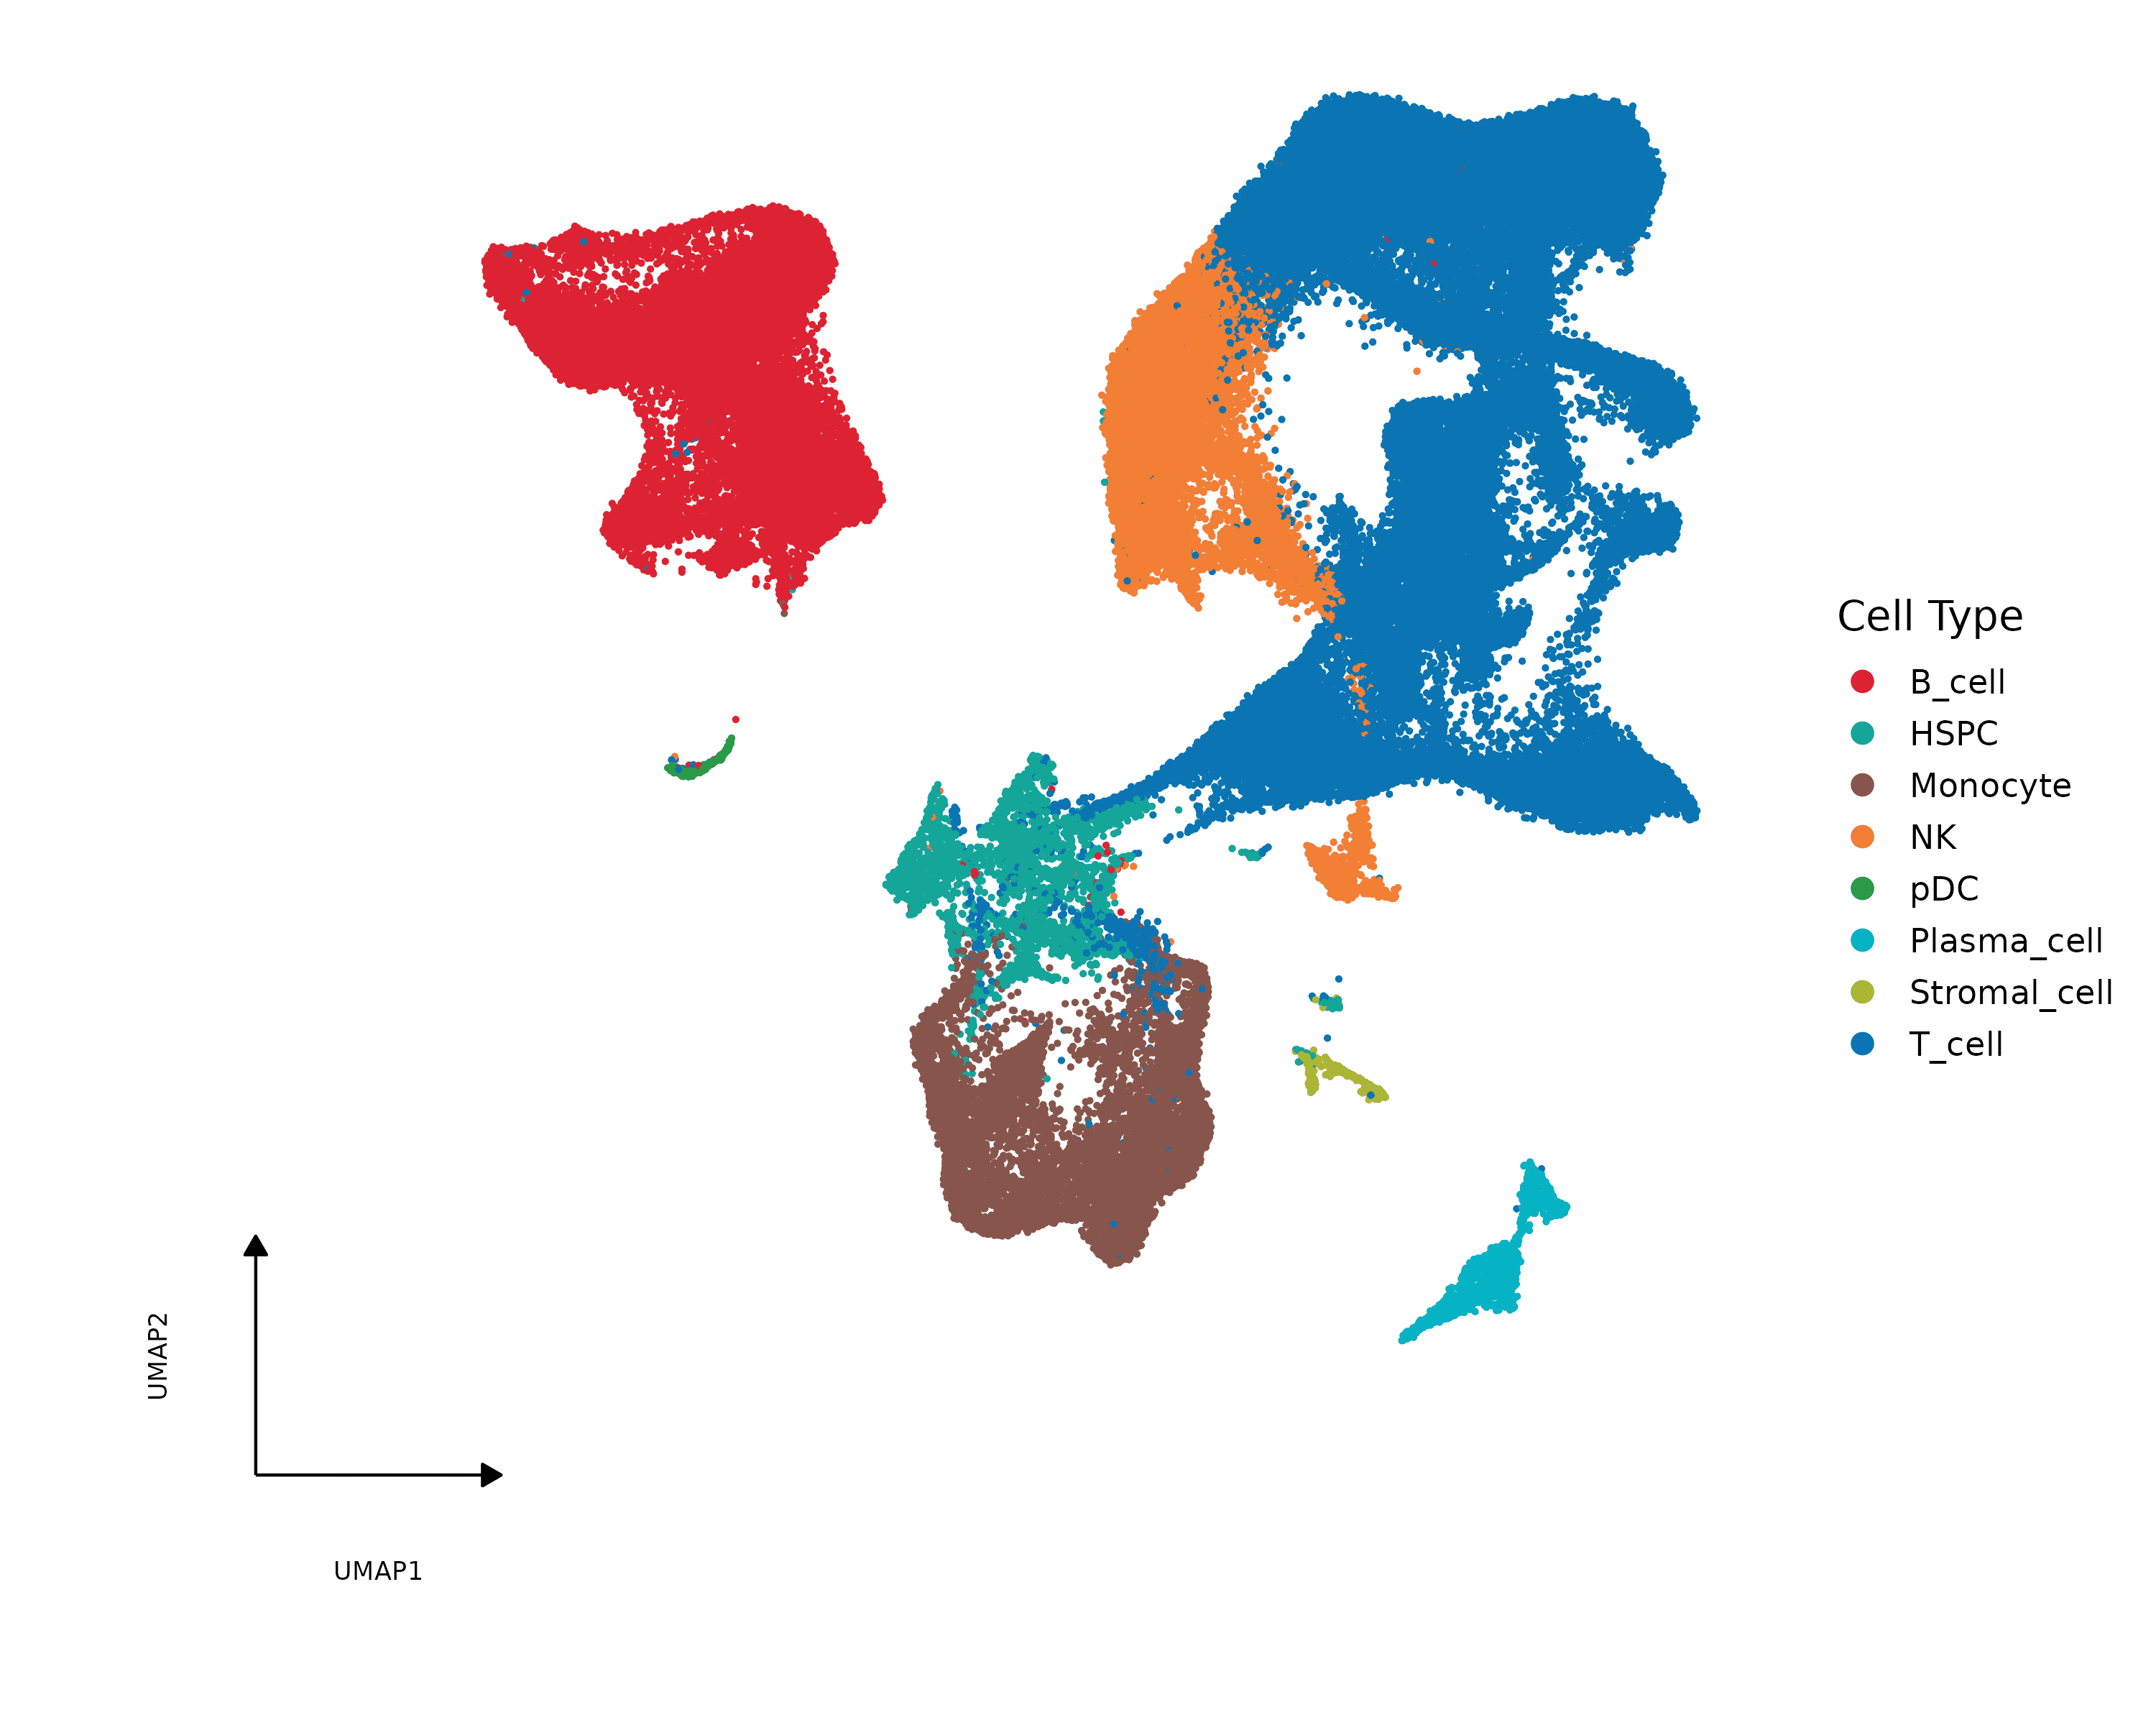
UMAP Clustering

Compare the relative abundance of annotated cell types across samples or study groups.

Image
Image
1/1
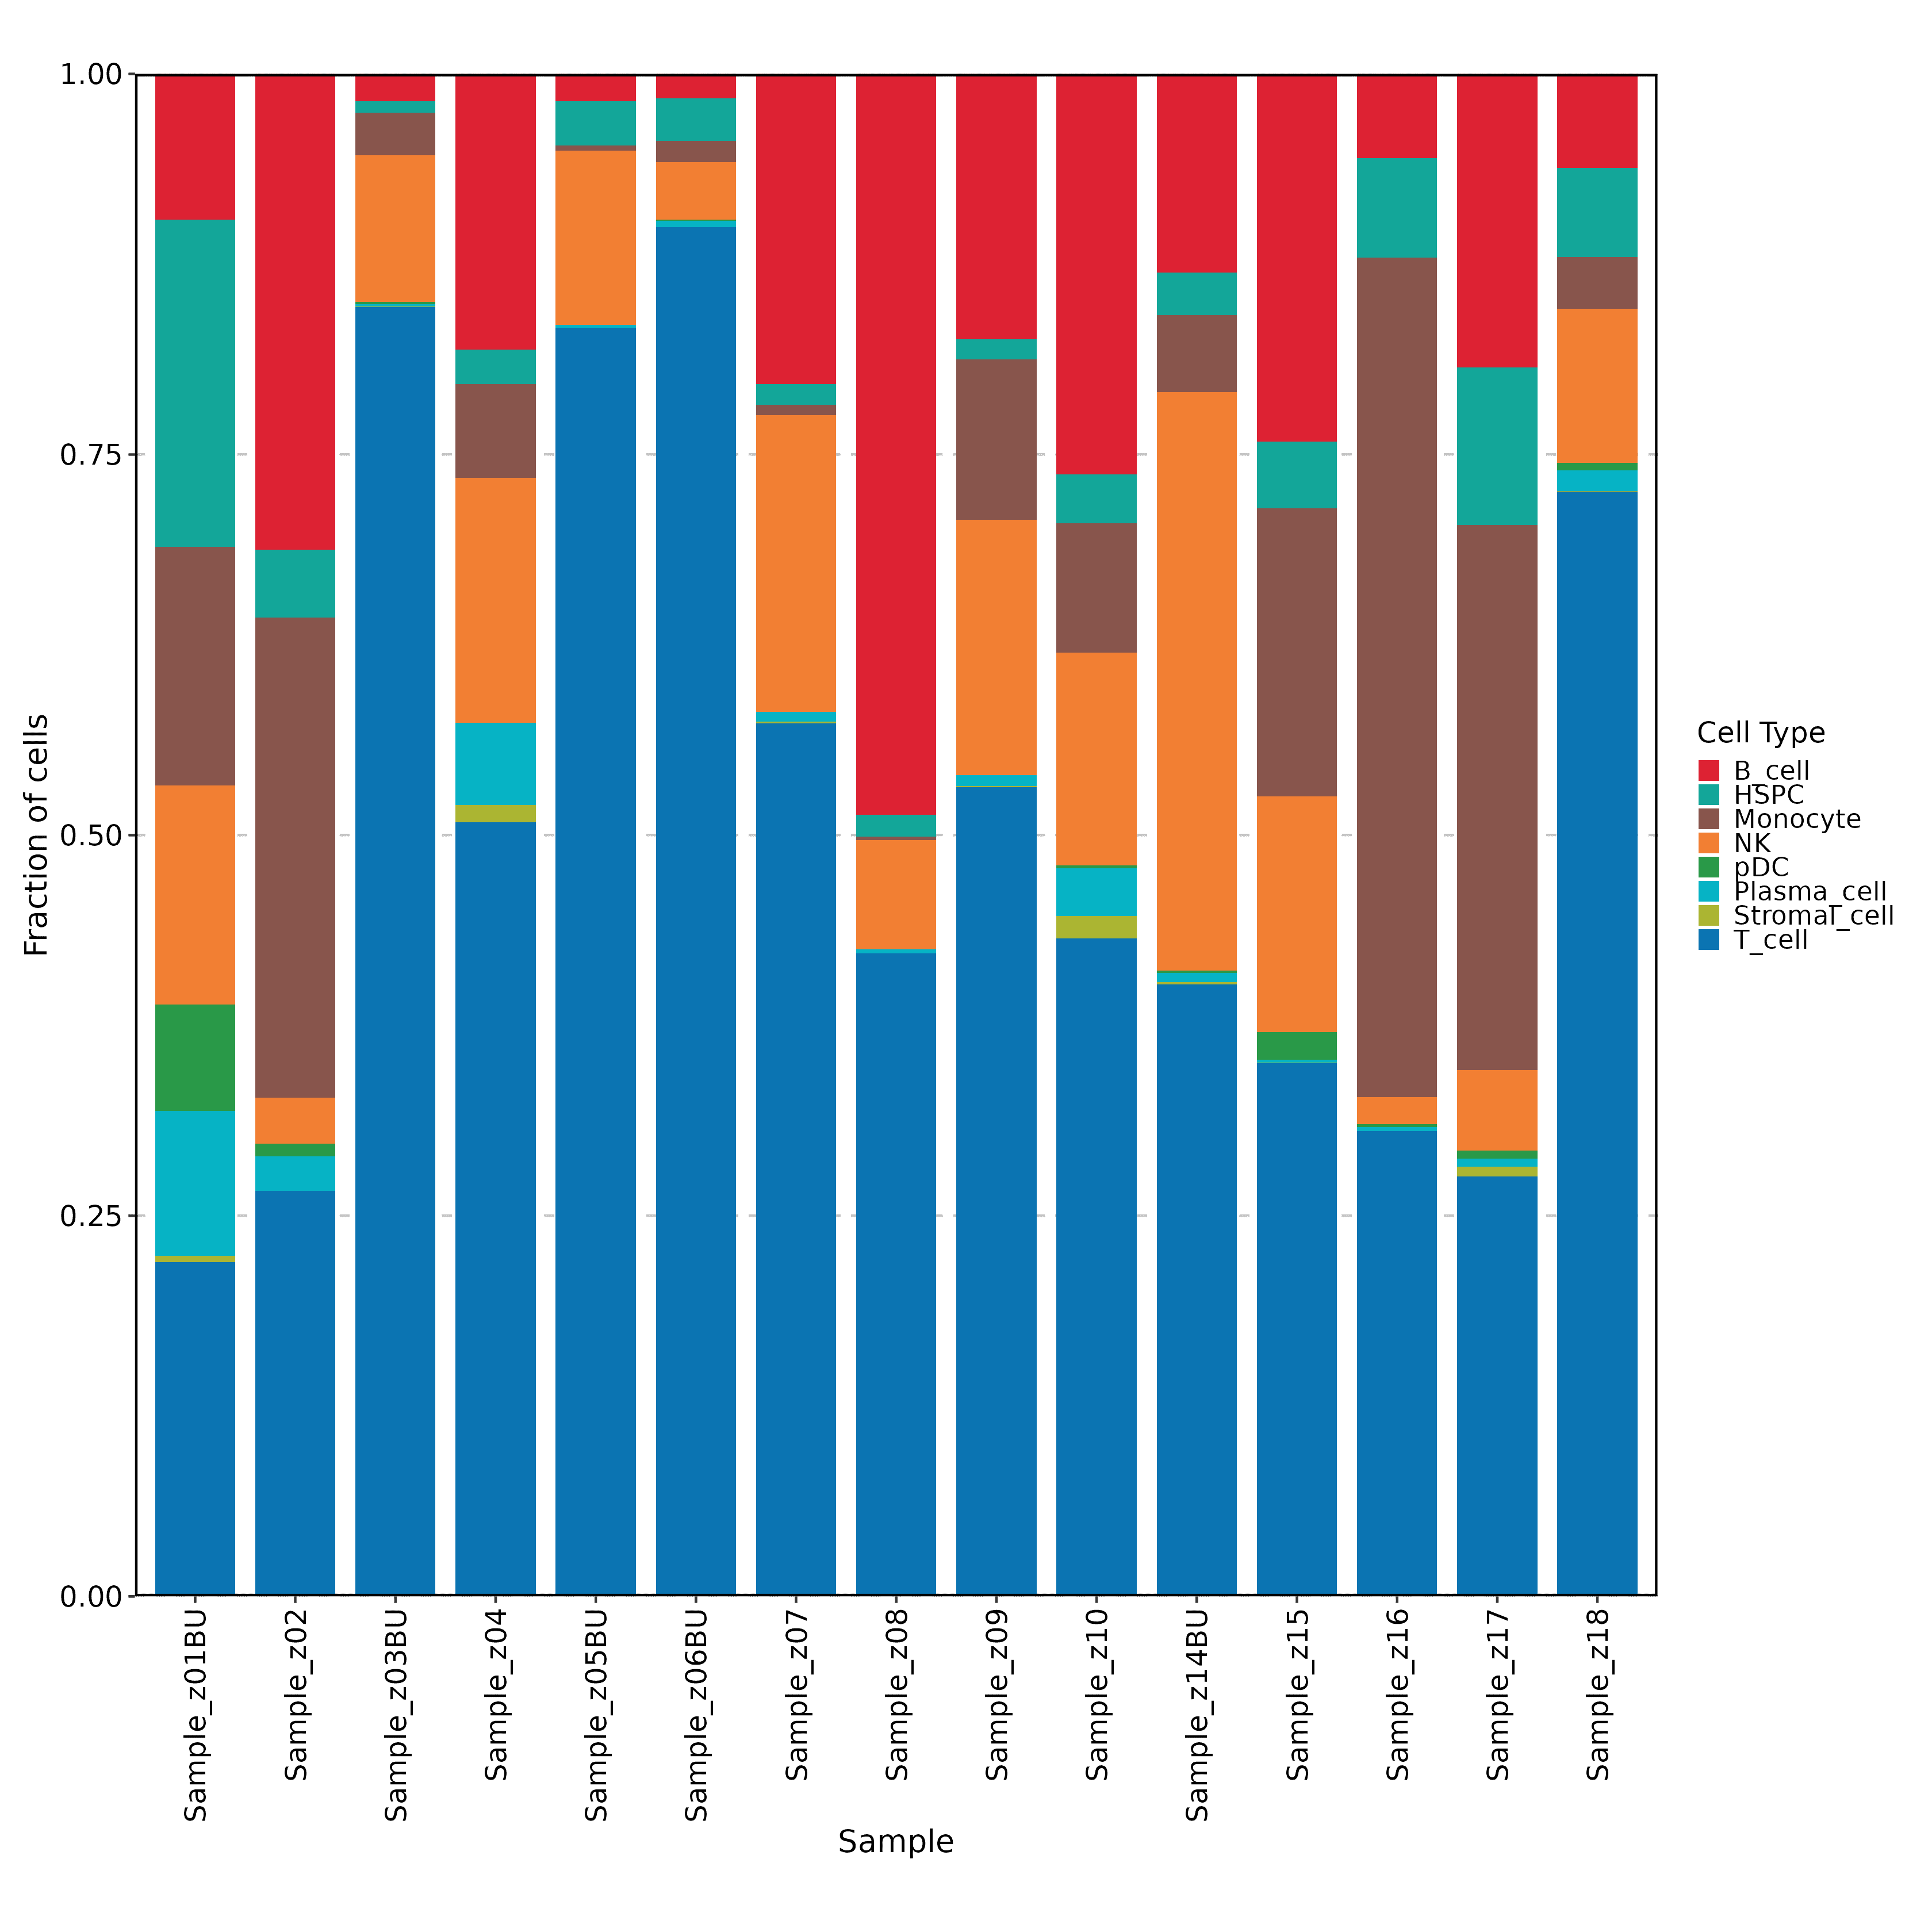
Cell Type Composition

Compare the relative abundance of annotated cell types across samples or study groups.

Image
Image
1/1
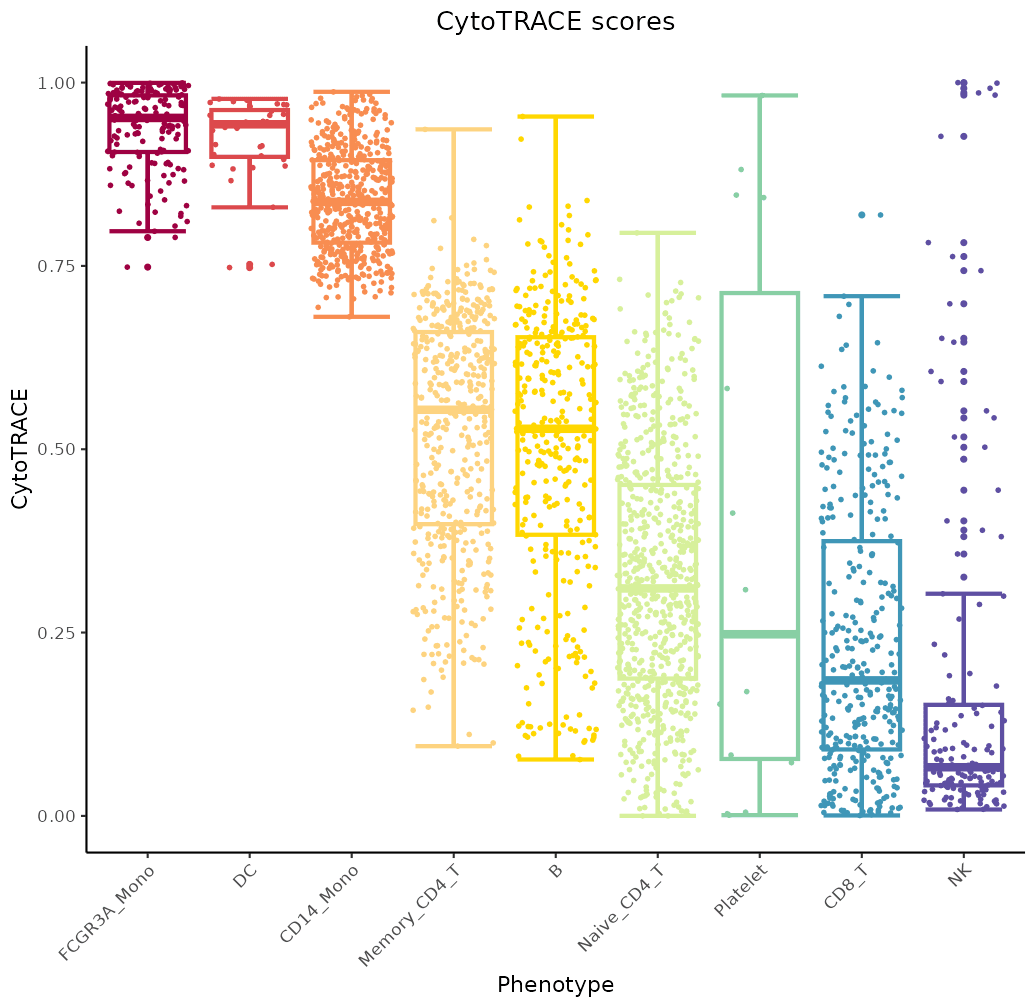
Cell State Potential

Assess predicted cell-state patterns to support interpretation of cellular transitions and functional heterogeneity.

Image
Image
1/1
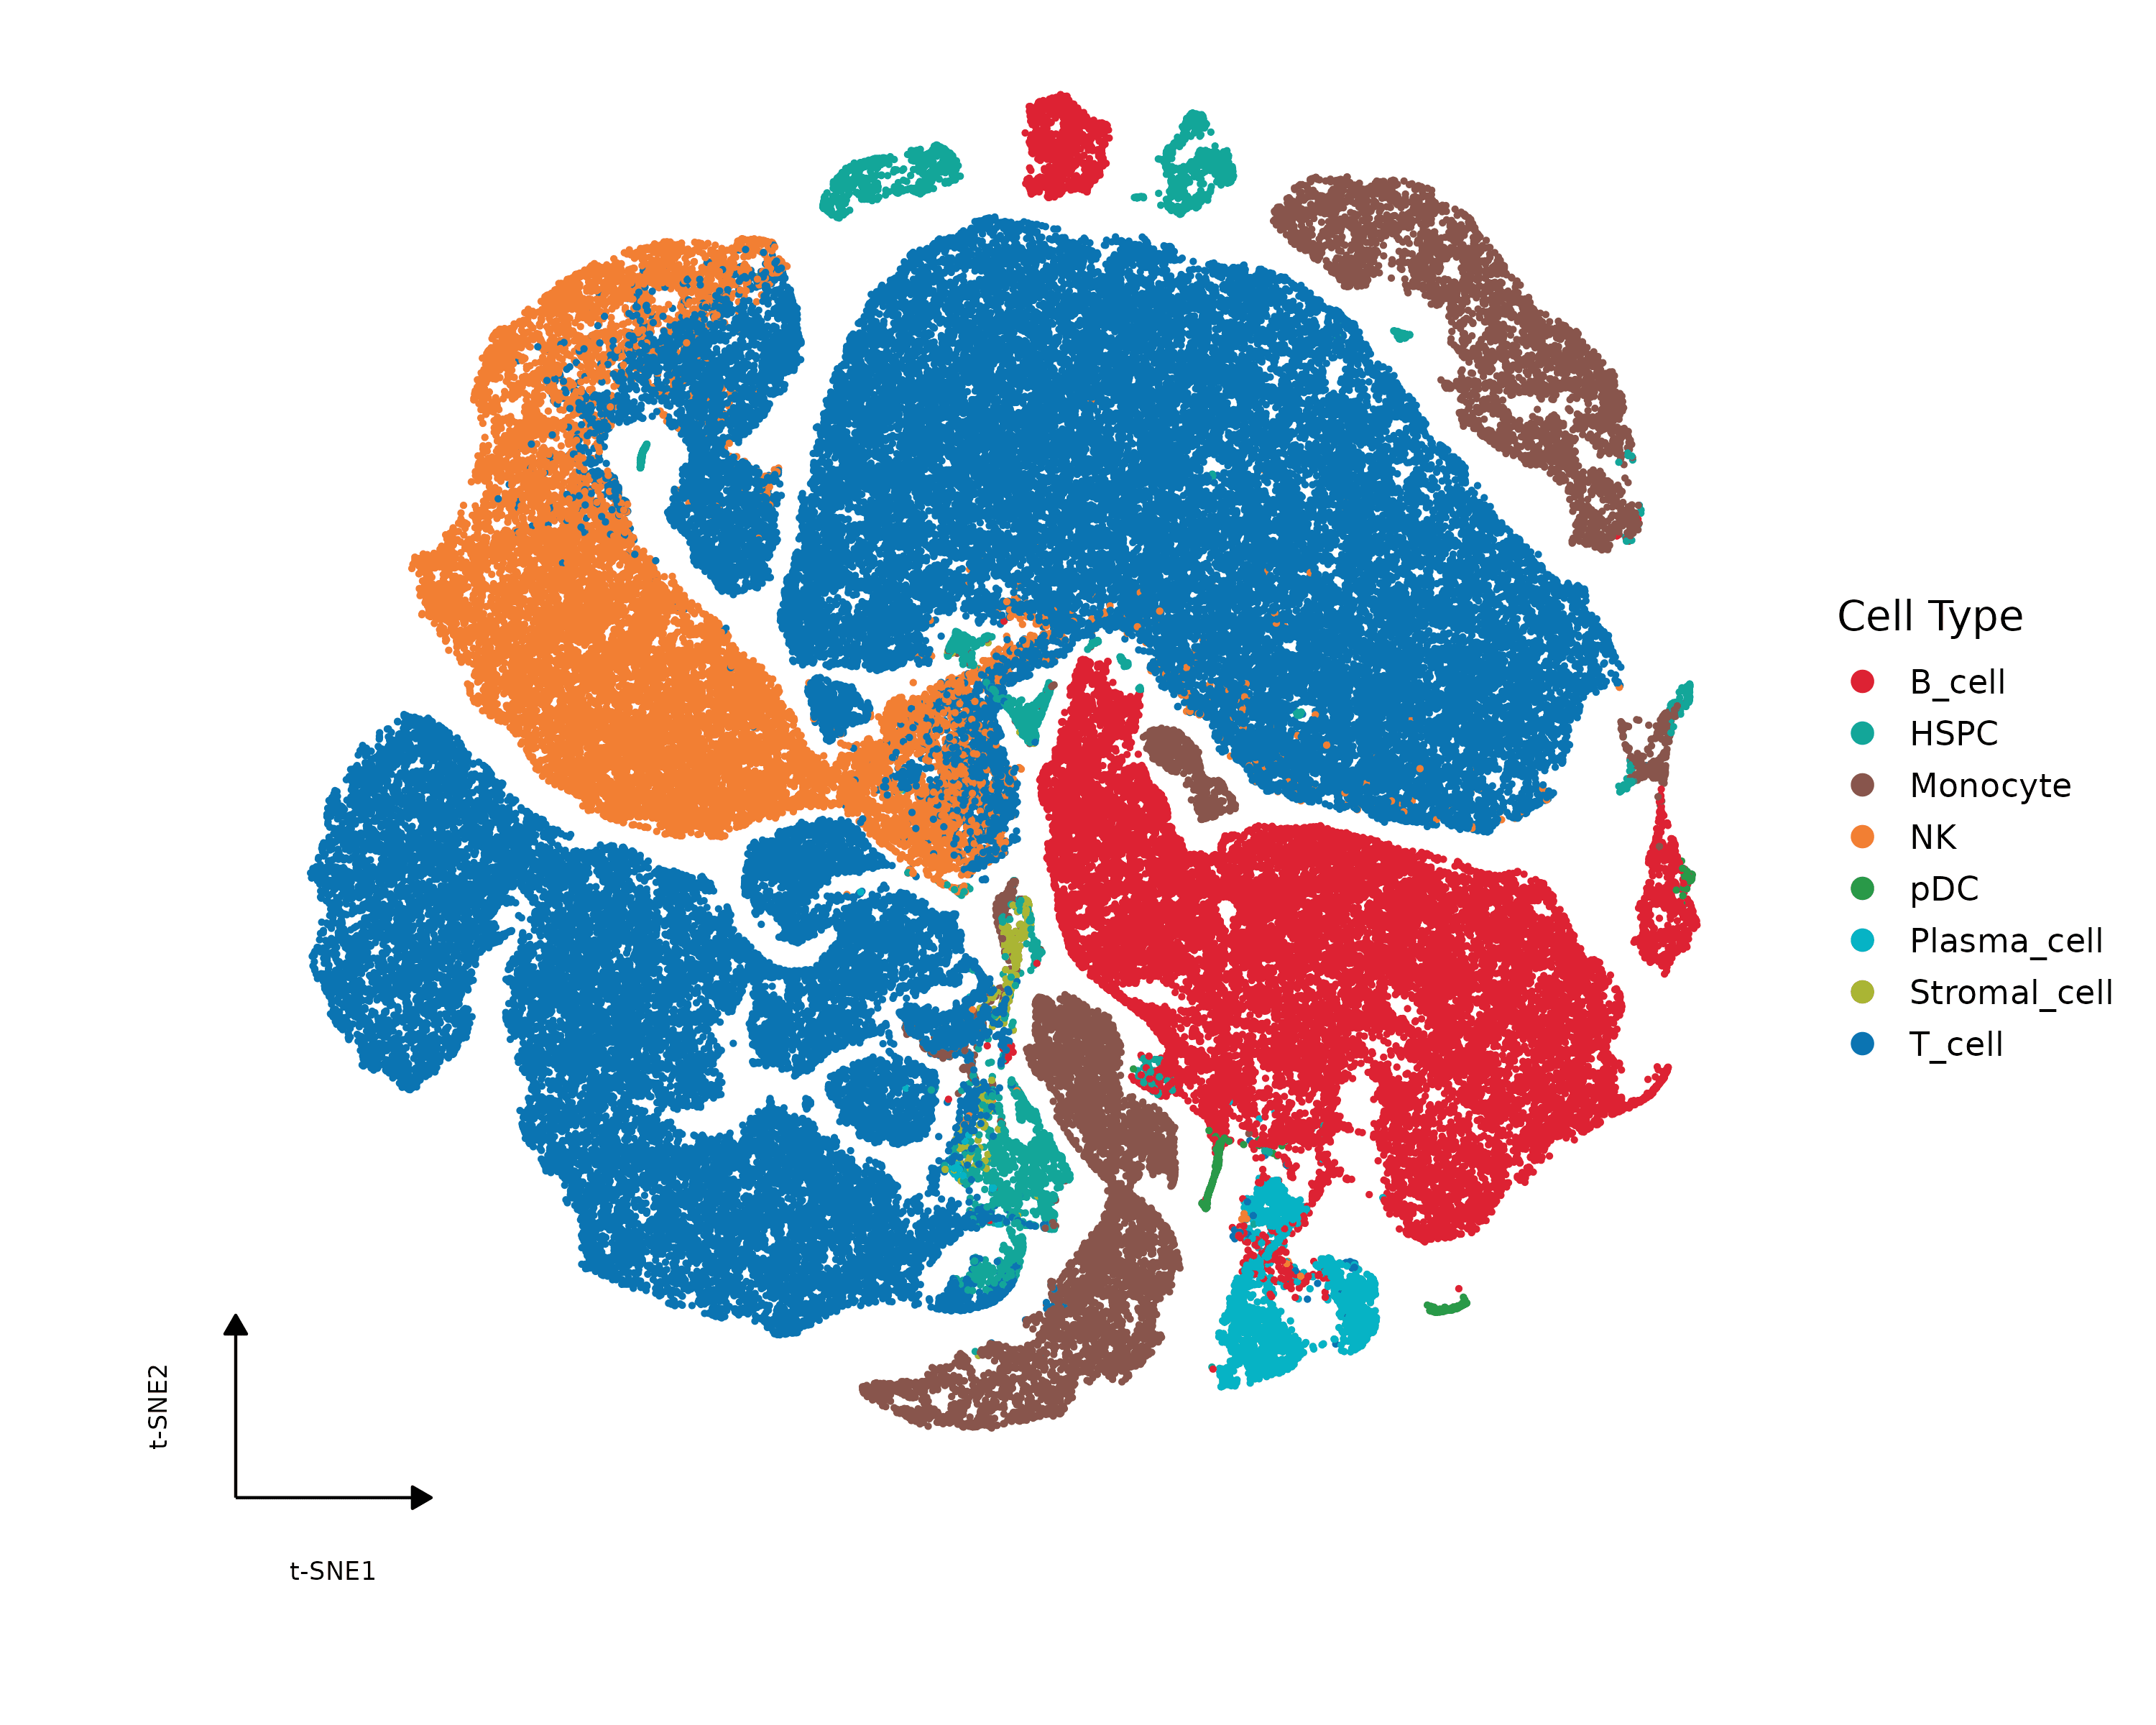
Cell-type t-SNE

Display annotated cell populations using t-SNE visualisation to support cell-type identification and exploratory analysis.

Image
Image
1/1
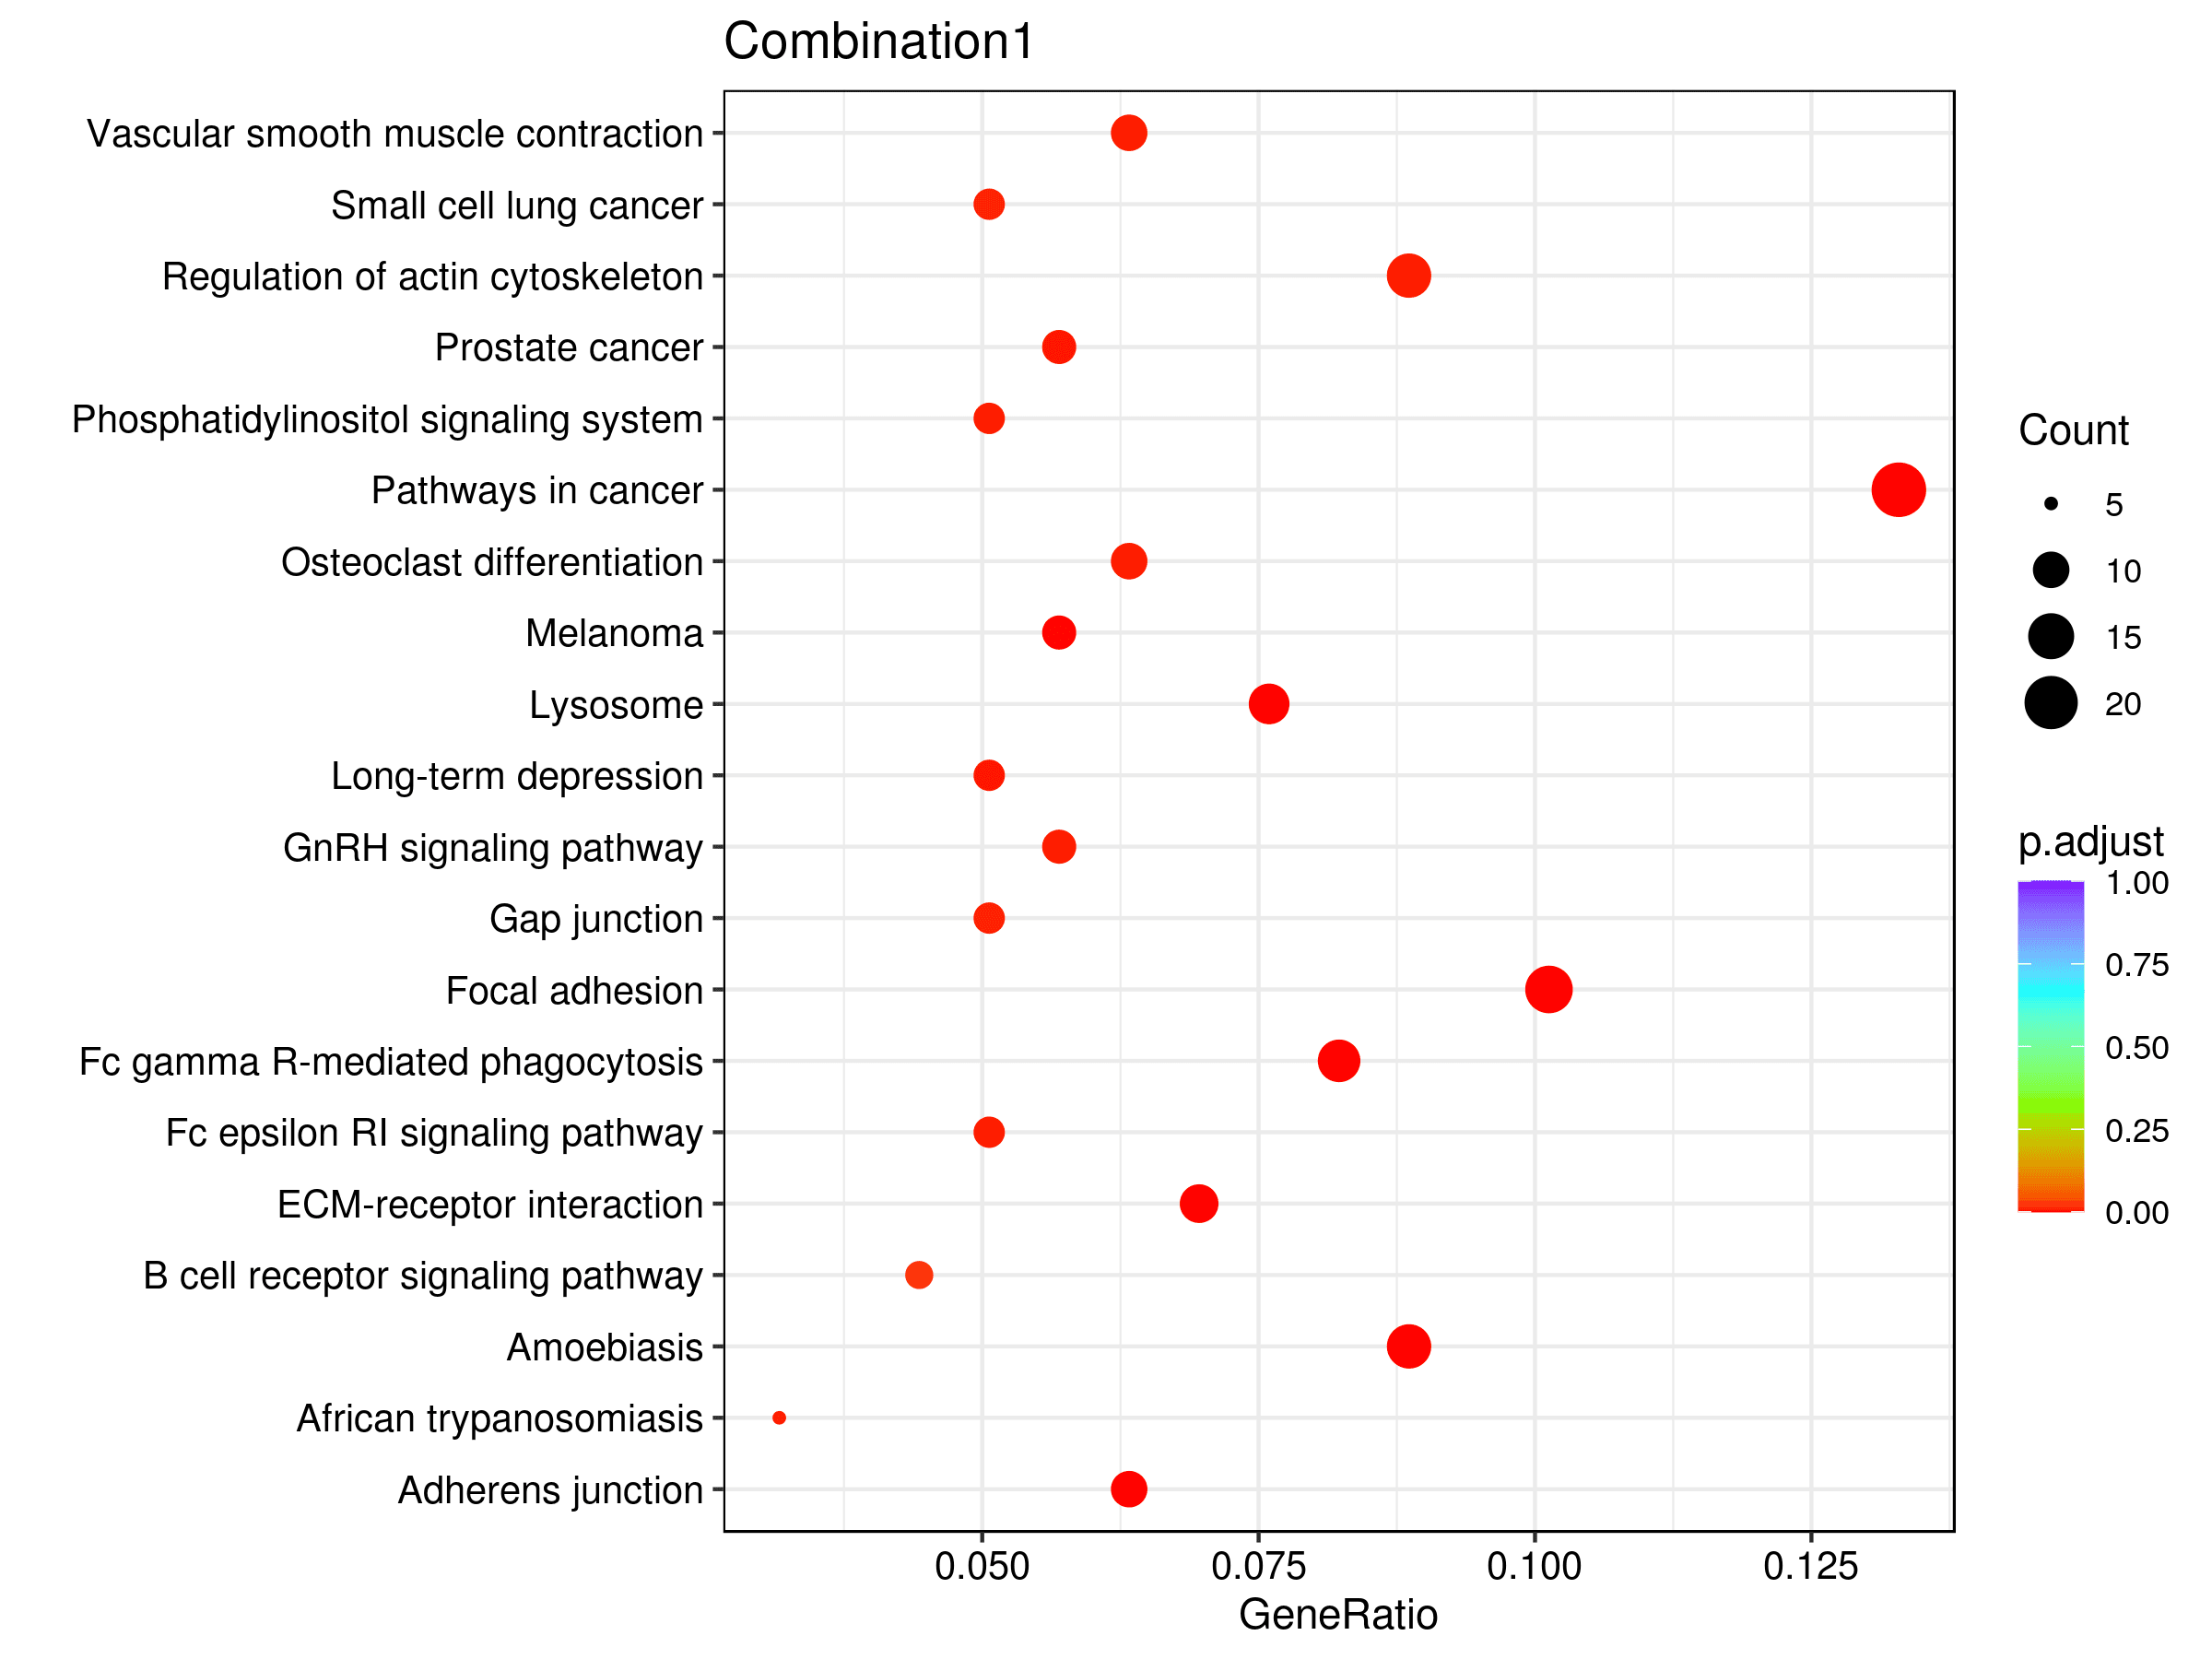
Marker Gene Enrichment

Identify enriched pathways or functional categories associated with marker genes from selected cell clusters.

Image
Image
1/1
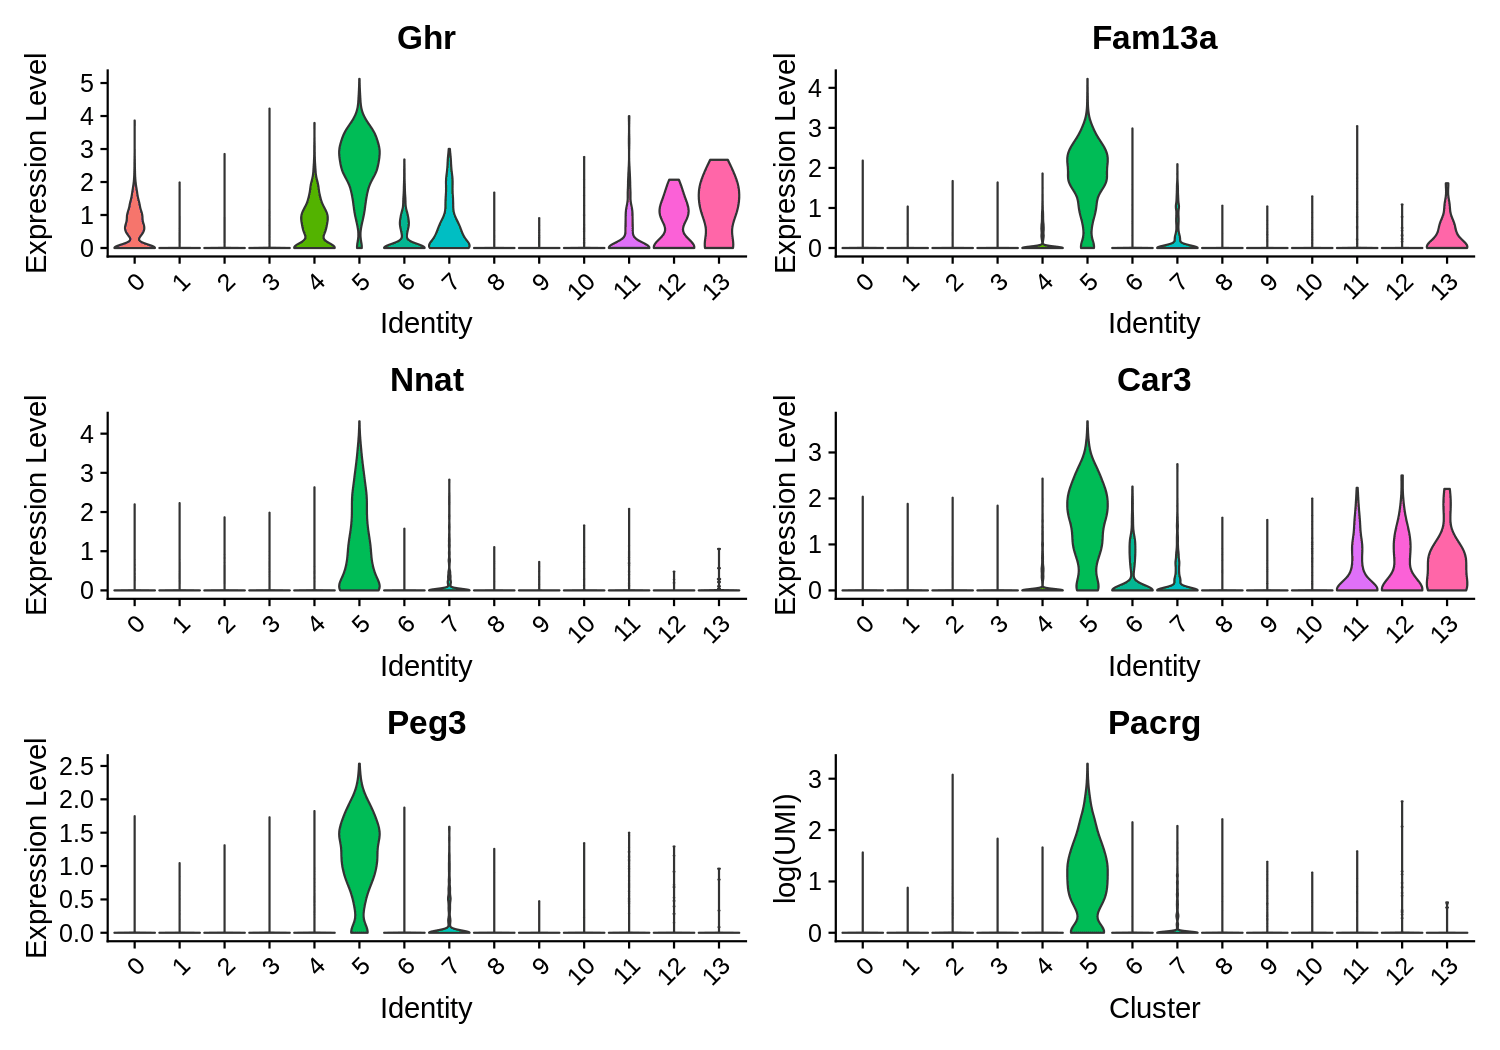
Marker Gene Expression

Visualise marker gene expression across cell groups to support cluster annotation and biological interpretation.

Image
Image
1/1
UMAP Clustering

Compare the relative abundance of annotated cell types across samples or study groups.

Image
Image
1/1
Cell Type Composition

Compare the relative abundance of annotated cell types across samples or study groups.

Image
Image
1/1
Cell State Potential

Assess predicted cell-state patterns to support interpretation of cellular transitions and functional heterogeneity.

Image
Image
1/1
Cell-type t-SNE

Display annotated cell populations using t-SNE visualisation to support cell-type identification and exploratory analysis.

Image
Image
1/1
Marker Gene Enrichment

Identify enriched pathways or functional categories associated with marker genes from selected cell clusters.

Image
Image
1/1
Marker Gene Expression

Visualise marker gene expression across cell groups to support cluster annotation and biological interpretation.

Resources

Example Analysis Output

Image
Image
1/1
UMAP Clustering

Compare the relative abundance of annotated cell types across samples or study groups.

Image
Image
1/1
Cell Type Composition

Compare the relative abundance of annotated cell types across samples or study groups.

Image
Image
1/1
Cell State Potential

Assess predicted cell-state patterns to support interpretation of cellular transitions and functional heterogeneity.

Image
Image
1/1
Cell-type t-SNE

Display annotated cell populations using t-SNE visualisation to support cell-type identification and exploratory analysis.

Image
Image
1/1
Marker Gene Enrichment

Identify enriched pathways or functional categories associated with marker genes from selected cell clusters.

Image
Image
1/1
Marker Gene Expression

Visualise marker gene expression across cell groups to support cluster annotation and biological interpretation.

Image
Image
1/1
UMAP Clustering

Compare the relative abundance of annotated cell types across samples or study groups.

Image
Image
1/1
Cell Type Composition

Compare the relative abundance of annotated cell types across samples or study groups.

Image
Image
1/1
Cell State Potential

Assess predicted cell-state patterns to support interpretation of cellular transitions and functional heterogeneity.

Image
Image
1/1
Cell-type t-SNE

Display annotated cell populations using t-SNE visualisation to support cell-type identification and exploratory analysis.

Image
Image
1/1
Marker Gene Enrichment

Identify enriched pathways or functional categories associated with marker genes from selected cell clusters.

Image
Image
1/1
Marker Gene Expression

Visualise marker gene expression across cell groups to support cluster annotation and biological interpretation.

Webinars

Unravel biological complexity with streamlined single cell solution

Discover how single-cell sequencing can reveal cellular heterogeneity, identify rare cell populations, and uncover molecular mechanisms within complex tissues. This webinar will explore 10x Genomics Chromium Single Cell solutions, key research applications, and best practices for generating and analysing high-quality single-cell data.

Learn More
(Unravel biological complexity with streamlined single cell solution)
Unravel biological complexity with streamlined single cell solution

Discover how single-cell sequencing can reveal cellular heterogeneity, identify rare cell populations, and uncover molecular mechanisms within complex tissues. This webinar will explore 10x Genomics Chromium Single Cell solutions, key research applications, and best practices for generating and analysing high-quality single-cell data.

Learn More
(Unravel biological complexity with streamlined single cell solution)
Unravel biological complexity with streamlined single cell solution

Discover how single-cell sequencing can reveal cellular heterogeneity, identify rare cell populations, and uncover molecular mechanisms within complex tissues. This webinar will explore 10x Genomics Chromium Single Cell solutions, key research applications, and best practices for generating and analysing high-quality single-cell data.

Learn More
(Unravel biological complexity with streamlined single cell solution)
Unravel biological complexity with streamlined single cell solution

Discover how single-cell sequencing can reveal cellular heterogeneity, identify rare cell populations, and uncover molecular mechanisms within complex tissues. This webinar will explore 10x Genomics Chromium Single Cell solutions, key research applications, and best practices for generating and analysing high-quality single-cell data.

Learn More
(Unravel biological complexity with streamlined single cell solution)
Getting More from Single-Cell Sequencing with 10x Genomics GEM-X

Explore the latest advances in 10x Genomics GEM-X technology, including 3′ and 5′ gene expression workflows, improved assay performance and practical considerations for sample preparation, experimental design and data analysis.

Learn More
(Getting More from Single-Cell Sequencing with 10x Genomics GEM-X)
Getting More from Single-Cell Sequencing with 10x Genomics GEM-X

Explore the latest advances in 10x Genomics GEM-X technology, including 3′ and 5′ gene expression workflows, improved assay performance and practical considerations for sample preparation, experimental design and data analysis.

Learn More
(Getting More from Single-Cell Sequencing with 10x Genomics GEM-X)
Getting More from Single-Cell Sequencing with 10x Genomics GEM-X

Explore the latest advances in 10x Genomics GEM-X technology, including 3′ and 5′ gene expression workflows, improved assay performance and practical considerations for sample preparation, experimental design and data analysis.

Learn More
(Getting More from Single-Cell Sequencing with 10x Genomics GEM-X)
Getting More from Single-Cell Sequencing with 10x Genomics GEM-X

Explore the latest advances in 10x Genomics GEM-X technology, including 3′ and 5′ gene expression workflows, improved assay performance and practical considerations for sample preparation, experimental design and data analysis.

Learn More
(Getting More from Single-Cell Sequencing with 10x Genomics GEM-X)

Frequently Asked Questions

What is the difference between 3′, 5′ and Flex single-cell gene expression?

What species are suitable for 10x Genomics 3′ gene expression?

Our 3′ gene expression workflows support a range of eukaryotic species. For plant samples, Novogene Europe currently offers a single-nucleus RNA-seq workflow. Project suitability depends on species, sample type and study requirements.

What sample types can be used for single-cell gene expression?

When should I consider single-nucleus rather than single-cell RNA sequencing?

How should samples be shipped for single-cell gene expression analysis?

Explore Single-cell & Spatial Resources

Access webinars, brochures and case studies covering sequencing technologies, study planning and data interpretation.
View Webinar Library
(Explore Single-cell & Spatial Resources)
View Webinar Library
(Explore Single-cell & Spatial Resources)
Background
Background

Speak with a Specialist

Have a project in mind?


Send us your enquiry and a Novogene Europe specialist will be in touch.


Privacy PolicyCookie PolicyTerms
banner laptop bg
banner mobile bg

Single-cell Gene Expression

High-resolution single-cell and single-nucleus transcriptome profiling to explore cellular heterogeneity, cell states and gene expression dynamics.
OverviewOverview
3′ Gene Expression3′ Gene Expression
5′ Gene Expression5′ Gene Expression
Flex Gene ExpressionFlex Gene Expression
SpecificationsSpecifications
ResourcesResources

Single-cell RNA sequencing (scRNA-seq) enables researchers to investigate gene expression at the level of individual cells, revealing cellular heterogeneity, identifying distinct cell populations and exploring transcriptional changes that may be masked in bulk RNA sequencing. It provides valuable insights into cell identity, developmental processes, cellular responses and the molecular mechanisms underlying complex biological systems.


Novogene Europe offers single-cell and single-nucleus gene expression profiling using 10x Genomics Chromium technologies, supporting research across human, animal and plant systems. Our portfolio includes 3′ and 5′ gene expression workflows, alongside probe-based Flex Gene Expression for fixed cells, nuclei and FFPE samples. Together, these complementary approaches provide flexibility across sample types, experimental designs and research objectives.


With access to a broad range of sequencing and bioinformatics capabilities, Novogene Europe supports researchers throughout their single-cell projects, from experimental planning and workflow selection to data analysis and interpretation. Applications span oncology, immunology, neuroscience, developmental biology and plant research, including investigations of cellular diversity, tissue responses and complex biological processes.

3′ Gene Expression

Transcriptome-wide profiling across diverse biological systems

Profile gene expression in individual cells or nuclei to characterise cellular heterogeneity, identify cell populations and investigate transcriptional responses across human, animal and plant research.

Key highlights

Cellular heterogeneity: Identify and characterise distinct cell populations.
Gene expression: Explore cell-specific transcriptional profiles and responses.
Broad sample applications: Support diverse tissues and biological systems, including plant protoplasts and nuclei.
Preview
Transcriptome-wide profiling across diverse biological systems

Profile gene expression in individual cells or nuclei to characterise cellular heterogeneity, identify cell populations and investigate transcriptional responses across human, animal and plant research.

Key highlights

Cellular heterogeneity: Identify and characterise distinct cell populations.
Gene expression: Explore cell-specific transcriptional profiles and responses.
Broad sample applications: Support diverse tissues and biological systems, including plant protoplasts and nuclei.
Preview

3′ Gene Expression

Transcriptome-wide profiling across diverse biological systems

Profile gene expression in individual cells or nuclei to characterise cellular heterogeneity, identify cell populations and investigate transcriptional responses across human, animal and plant research.

Key highlights

Cellular heterogeneity: Identify and characterise distinct cell populations.
Gene expression: Explore cell-specific transcriptional profiles and responses.
Broad sample applications: Support diverse tissues and biological systems, including plant protoplasts and nuclei.
Preview
Transcriptome-wide profiling across diverse biological systems

Profile gene expression in individual cells or nuclei to characterise cellular heterogeneity, identify cell populations and investigate transcriptional responses across human, animal and plant research.

Key highlights

Cellular heterogeneity: Identify and characterise distinct cell populations.
Gene expression: Explore cell-specific transcriptional profiles and responses.
Broad sample applications: Support diverse tissues and biological systems, including plant protoplasts and nuclei.
Preview

5′ Gene Expression

Connect gene expression with immune repertoire profiling

Characterise cellular transcriptional states with the option to integrate T-cell and B-cell receptor profiling through dedicated V(D)J workflows, supporting deeper investigation of immune cell diversity and function.

Key highlights

Immune cell profiling: Characterise immune cell populations and transcriptional states.
TCR & BCR analysis: Explore receptor diversity and clonal relationships.
Integrated insights: Link immune receptor information with gene expression profiles.
Preview
Connect gene expression with immune repertoire profiling

Characterise cellular transcriptional states with the option to integrate T-cell and B-cell receptor profiling through dedicated V(D)J workflows, supporting deeper investigation of immune cell diversity and function.

Key highlights

Immune cell profiling: Characterise immune cell populations and transcriptional states.
TCR & BCR analysis: Explore receptor diversity and clonal relationships.
Integrated insights: Link immune receptor information with gene expression profiles.
Preview

5′ Gene Expression

Connect gene expression with immune repertoire profiling

Characterise cellular transcriptional states with the option to integrate T-cell and B-cell receptor profiling through dedicated V(D)J workflows, supporting deeper investigation of immune cell diversity and function.

Key highlights

Immune cell profiling: Characterise immune cell populations and transcriptional states.
TCR & BCR analysis: Explore receptor diversity and clonal relationships.
Integrated insights: Link immune receptor information with gene expression profiles.
Preview
Connect gene expression with immune repertoire profiling

Characterise cellular transcriptional states with the option to integrate T-cell and B-cell receptor profiling through dedicated V(D)J workflows, supporting deeper investigation of immune cell diversity and function.

Key highlights

Immune cell profiling: Characterise immune cell populations and transcriptional states.
TCR & BCR analysis: Explore receptor diversity and clonal relationships.
Integrated insights: Link immune receptor information with gene expression profiles.
Preview

Flex Gene Expression

Probe-based profiling for fixed and FFPE samples

Profile gene expression in fixed cells, nuclei and FFPE samples using 10x Genomics GEM-X Flex v2 (Apex). The workflow supports flexible sample collection, preservation and multiplexing for scalable single-cell studies.

Key highlights

Sample compatibility: Fixed cells, nuclei and FFPE tissue.
Flexible multiplexing: Up to 24 samples per run.
Scalable study design: Support large-cohort, longitudinal and multi-site studies.
Preview
Probe-based profiling for fixed and FFPE samples

Profile gene expression in fixed cells, nuclei and FFPE samples using 10x Genomics GEM-X Flex v2 (Apex). The workflow supports flexible sample collection, preservation and multiplexing for scalable single-cell studies.

Key highlights

Sample compatibility: Fixed cells, nuclei and FFPE tissue.
Flexible multiplexing: Up to 24 samples per run.
Scalable study design: Support large-cohort, longitudinal and multi-site studies.
Preview

Flex Gene Expression

Probe-based profiling for fixed and FFPE samples

Profile gene expression in fixed cells, nuclei and FFPE samples using 10x Genomics GEM-X Flex v2 (Apex). The workflow supports flexible sample collection, preservation and multiplexing for scalable single-cell studies.

Key highlights

Sample compatibility: Fixed cells, nuclei and FFPE tissue.
Flexible multiplexing: Up to 24 samples per run.
Scalable study design: Support large-cohort, longitudinal and multi-site studies.
Preview
Probe-based profiling for fixed and FFPE samples

Profile gene expression in fixed cells, nuclei and FFPE samples using 10x Genomics GEM-X Flex v2 (Apex). The workflow supports flexible sample collection, preservation and multiplexing for scalable single-cell studies.

Key highlights

Sample compatibility: Fixed cells, nuclei and FFPE tissue.
Flexible multiplexing: Up to 24 samples per run.
Scalable study design: Support large-cohort, longitudinal and multi-site studies.
Preview

Specifications

Sample Requirements

The quantities listed are provided for reference only. Please download the Sample Requirements for detailed guidance, or Contact us to discuss your project-specific requirements.

ServiceAssaySample Type**Recommended AmountOther details
scRNA-seq3’ GEXCryopreserved cell suspension2-3 M cells
Cell viability > 70%
• Samples should be cryopreserved
with freezing media.
• Shipped in cryovials with dry ice.
Fresh
tissues/organoids
> 50 mg• Novogene will ship tissue storage
solution.
• Tissues must be placed in tissue
storage solution immediately after retrieval
and arrive in the lab within 48 hours.
• Shipped with ice packs.
Whole blood/Bone
marrow
(Mouse, Human, Rat)
2-4 mL
• Collected in EDTA vacutainer tubes.
• Shipped with ice packs.
snRNA-seq3’ GEXFresh frozen human/animal tissue or organoids> 50 mg• Shipped in cryovials with dry ice.
Fresh frozen plant tissue> 200 mg
sc/snRNA-seq10x Flex Gene Expression v2 (Apex)Fixed cell/nuclei suspension (Mouse, Human)≥ 500K fixed cells/sample
(minimum 320K cells/sample)
Sample viability ≥80% before fixation
• Cell dimeter: 5~30 μm
• Only stored at -80℃ up to 12months
• Provide ≥70μl Conc. • Quenching Buffer B per fixed sample
• Fix the cell/nuclei suspension following the 10x Genomics CG000782 Rev D protocol.
FFPE block (Mouse, Human)1 FFPE block
Tissue thickness > 1mm
• DV200 ≥ 30%
• After tissue dissociation, the nuclear count should ≥ 300K
FFPE section (Mouse, Human)Sample QC: 5-6 FFPE(5μm thickness) scrolls
Main experiment: 5-10 FFPE(10μm thickness) tissue rolls
• DV200 ≥ 30%
• After tissue dissociation, the nuclear count should ≥ 300K
*Contact us for species-specific recommendations and tissue type guidance.
**Sample type preferences may vary based on sequencing requirements and sample compatibility.

Sample Requirements

The quantities listed are provided for reference only. Please download the Sample Requirements for detailed guidance, or Contact us to discuss your project-specific requirements.

ServiceAssaySample Type**Recommended AmountOther details
scRNA-seq3’ GEXCryopreserved cell suspension2-3 M cells
Cell viability > 70%
• Samples should be cryopreserved
with freezing media.
• Shipped in cryovials with dry ice.
Fresh
tissues/organoids
> 50 mg• Novogene will ship tissue storage
solution.
• Tissues must be placed in tissue
storage solution immediately after retrieval
and arrive in the lab within 48 hours.
• Shipped with ice packs.
Whole blood/Bone
marrow
(Mouse, Human, Rat)
2-4 mL
• Collected in EDTA vacutainer tubes.
• Shipped with ice packs.
snRNA-seq3’ GEXFresh frozen human/animal tissue or organoids> 50 mg• Shipped in cryovials with dry ice.
Fresh frozen plant tissue> 200 mg
sc/snRNA-seq10x Flex Gene Expression v2 (Apex)Fixed cell/nuclei suspension (Mouse, Human)≥ 500K fixed cells/sample
(minimum 320K cells/sample)
Sample viability ≥80% before fixation
• Cell dimeter: 5~30 μm
• Only stored at -80℃ up to 12months
• Provide ≥70μl Conc. • Quenching Buffer B per fixed sample
• Fix the cell/nuclei suspension following the 10x Genomics CG000782 Rev D protocol.
FFPE block (Mouse, Human)1 FFPE block
Tissue thickness > 1mm
• DV200 ≥ 30%
• After tissue dissociation, the nuclear count should ≥ 300K
FFPE section (Mouse, Human)Sample QC: 5-6 FFPE(5μm thickness) scrolls
Main experiment: 5-10 FFPE(10μm thickness) tissue rolls
• DV200 ≥ 30%
• After tissue dissociation, the nuclear count should ≥ 300K
*Contact us for species-specific recommendations and tissue type guidance.
**Sample type preferences may vary based on sequencing requirements and sample compatibility.

Sample Requirements

The quantities listed are provided for reference only. Please download the Sample Requirements for detailed guidance, or Contact us to discuss your project-specific requirements.

ServiceAssaySample Type**Recommended AmountOther details
scRNA-seq3’ GEXCryopreserved cell suspension2-3 M cells
Cell viability > 70%
• Samples should be cryopreserved
with freezing media.
• Shipped in cryovials with dry ice.
Fresh
tissues/organoids
> 50 mg• Novogene will ship tissue storage
solution.
• Tissues must be placed in tissue
storage solution immediately after retrieval
and arrive in the lab within 48 hours.
• Shipped with ice packs.
Whole blood/Bone
marrow
(Mouse, Human, Rat)
2-4 mL
• Collected in EDTA vacutainer tubes.
• Shipped with ice packs.
snRNA-seq3’ GEXFresh frozen human/animal tissue or organoids> 50 mg• Shipped in cryovials with dry ice.
Fresh frozen plant tissue> 200 mg
sc/snRNA-seq10x Flex Gene Expression v2 (Apex)Fixed cell/nuclei suspension (Mouse, Human)≥ 500K fixed cells/sample
(minimum 320K cells/sample)
Sample viability ≥80% before fixation
• Cell dimeter: 5~30 μm
• Only stored at -80℃ up to 12months
• Provide ≥70μl Conc. • Quenching Buffer B per fixed sample
• Fix the cell/nuclei suspension following the 10x Genomics CG000782 Rev D protocol.
FFPE block (Mouse, Human)1 FFPE block
Tissue thickness > 1mm
• DV200 ≥ 30%
• After tissue dissociation, the nuclear count should ≥ 300K
FFPE section (Mouse, Human)Sample QC: 5-6 FFPE(5μm thickness) scrolls
Main experiment: 5-10 FFPE(10μm thickness) tissue rolls
• DV200 ≥ 30%
• After tissue dissociation, the nuclear count should ≥ 300K
*Contact us for species-specific recommendations and tissue type guidance.
**Sample type preferences may vary based on sequencing requirements and sample compatibility.

Sample Requirements

The quantities listed are provided for reference only. Please download the Sample Requirements for detailed guidance, or Contact us to discuss your project-specific requirements.

ServiceAssaySample Type**Recommended AmountOther details
scRNA-seq3’ GEXCryopreserved cell suspension2-3 M cells
Cell viability > 70%
• Samples should be cryopreserved
with freezing media.
• Shipped in cryovials with dry ice.
Fresh
tissues/organoids
> 50 mg• Novogene will ship tissue storage
solution.
• Tissues must be placed in tissue
storage solution immediately after retrieval
and arrive in the lab within 48 hours.
• Shipped with ice packs.
Whole blood/Bone
marrow
(Mouse, Human, Rat)
2-4 mL
• Collected in EDTA vacutainer tubes.
• Shipped with ice packs.
snRNA-seq3’ GEXFresh frozen human/animal tissue or organoids> 50 mg• Shipped in cryovials with dry ice.
Fresh frozen plant tissue> 200 mg
sc/snRNA-seq10x Flex Gene Expression v2 (Apex)Fixed cell/nuclei suspension (Mouse, Human)≥ 500K fixed cells/sample
(minimum 320K cells/sample)
Sample viability ≥80% before fixation
• Cell dimeter: 5~30 μm
• Only stored at -80℃ up to 12months
• Provide ≥70μl Conc. • Quenching Buffer B per fixed sample
• Fix the cell/nuclei suspension following the 10x Genomics CG000782 Rev D protocol.
FFPE block (Mouse, Human)1 FFPE block
Tissue thickness > 1mm
• DV200 ≥ 30%
• After tissue dissociation, the nuclear count should ≥ 300K
FFPE section (Mouse, Human)Sample QC: 5-6 FFPE(5μm thickness) scrolls
Main experiment: 5-10 FFPE(10μm thickness) tissue rolls
• DV200 ≥ 30%
• After tissue dissociation, the nuclear count should ≥ 300K
*Contact us for species-specific recommendations and tissue type guidance.
**Sample type preferences may vary based on sequencing requirements and sample compatibility.

Sequencing and Analysis

Recommended data outputs and analysis examples are provided for reference only. For detailed information, please  contact us to discuss your project-specific analysis requirements.

Sequencing PlatformIllumina NovaSeq X-Plus Sequencing Platform
Read LengthPaired-end 150 bp
Recommended Data3' & 5' GEX assay: 20,000 - 50,000 read pairs/cell, around 120Gb/sample
Flex Apex assay: 10,000 - 20,000 reads per recovered cell, corresponding to approximately 30 - 60 Gb/sample.
AnalysisCell Ranger AnalysisStandard Analysis
Demultiplex BCL files from a sequencer into FASTQs.
Summary metrics (sequencing quality, number of cells detected, the mean reads per cell, and the median genes detected per cell et al.).
Alignment of reads to genome.
Gene expression quantification.
Clustering analysis.
Differentially expression analysis between clusters.
Visualization.
Demultiplex BCL files from a sequencer into FASTQs.
Alignment, UMI counting, Metrics summary.
Identification of highly variable gene (HVGs).
Cell Subpopulation Identification.
Principal component analysis (PCA).
Identify clusters of cells.
Dimensionality reduction and Visualization.
Marker gene detection (Differentially expression analysis between clusters).
GO/KEGG/Reactome Enrichment.
FunctionalAnnotation of Transcription Factor.
Protein-Protein Interaction Network Analysis.

Sequencing and Analysis

Recommended data outputs and analysis examples are provided for reference only. For detailed information, please  contact us to discuss your project-specific analysis requirements.

Sequencing PlatformIllumina NovaSeq X-Plus Sequencing Platform
Read LengthPaired-end 150 bp
Recommended Data3' & 5' GEX assay: 20,000 - 50,000 read pairs/cell, around 120Gb/sample
Flex Apex assay: 10,000 - 20,000 reads per recovered cell, corresponding to approximately 30 - 60 Gb/sample.
AnalysisCell Ranger AnalysisStandard Analysis
Demultiplex BCL files from a sequencer into FASTQs.
Summary metrics (sequencing quality, number of cells detected, the mean reads per cell, and the median genes detected per cell et al.).
Alignment of reads to genome.
Gene expression quantification.
Clustering analysis.
Differentially expression analysis between clusters.
Visualization.
Demultiplex BCL files from a sequencer into FASTQs.
Alignment, UMI counting, Metrics summary.
Identification of highly variable gene (HVGs).
Cell Subpopulation Identification.
Principal component analysis (PCA).
Identify clusters of cells.
Dimensionality reduction and Visualization.
Marker gene detection (Differentially expression analysis between clusters).
GO/KEGG/Reactome Enrichment.
FunctionalAnnotation of Transcription Factor.
Protein-Protein Interaction Network Analysis.

Sequencing and Analysis

Recommended data outputs and analysis examples are provided for reference only. For detailed information, please  contact us to discuss your project-specific analysis requirements.

Sequencing PlatformIllumina NovaSeq X-Plus Sequencing Platform
Read LengthPaired-end 150 bp
Recommended Data3' & 5' GEX assay: 20,000 - 50,000 read pairs/cell, around 120Gb/sample
Flex Apex assay: 10,000 - 20,000 reads per recovered cell, corresponding to approximately 30 - 60 Gb/sample.
AnalysisCell Ranger AnalysisStandard Analysis
Demultiplex BCL files from a sequencer into FASTQs.
Summary metrics (sequencing quality, number of cells detected, the mean reads per cell, and the median genes detected per cell et al.).
Alignment of reads to genome.
Gene expression quantification.
Clustering analysis.
Differentially expression analysis between clusters.
Visualization.
Demultiplex BCL files from a sequencer into FASTQs.
Alignment, UMI counting, Metrics summary.
Identification of highly variable gene (HVGs).
Cell Subpopulation Identification.
Principal component analysis (PCA).
Identify clusters of cells.
Dimensionality reduction and Visualization.
Marker gene detection (Differentially expression analysis between clusters).
GO/KEGG/Reactome Enrichment.
FunctionalAnnotation of Transcription Factor.
Protein-Protein Interaction Network Analysis.

Sequencing and Analysis

Recommended data outputs and analysis examples are provided for reference only. For detailed information, please  contact us to discuss your project-specific analysis requirements.

Sequencing PlatformIllumina NovaSeq X-Plus Sequencing Platform
Read LengthPaired-end 150 bp
Recommended Data3' & 5' GEX assay: 20,000 - 50,000 read pairs/cell, around 120Gb/sample
Flex Apex assay: 10,000 - 20,000 reads per recovered cell, corresponding to approximately 30 - 60 Gb/sample.
AnalysisCell Ranger AnalysisStandard Analysis
Demultiplex BCL files from a sequencer into FASTQs.
Summary metrics (sequencing quality, number of cells detected, the mean reads per cell, and the median genes detected per cell et al.).
Alignment of reads to genome.
Gene expression quantification.
Clustering analysis.
Differentially expression analysis between clusters.
Visualization.
Demultiplex BCL files from a sequencer into FASTQs.
Alignment, UMI counting, Metrics summary.
Identification of highly variable gene (HVGs).
Cell Subpopulation Identification.
Principal component analysis (PCA).
Identify clusters of cells.
Dimensionality reduction and Visualization.
Marker gene detection (Differentially expression analysis between clusters).
GO/KEGG/Reactome Enrichment.
FunctionalAnnotation of Transcription Factor.
Protein-Protein Interaction Network Analysis.

Specifications

Sample Requirements

The quantities listed are provided for reference only. Please download the Sample Requirements for detailed guidance, or Contact us to discuss your project-specific requirements.

ServiceAssaySample Type**Recommended AmountOther details
scRNA-seq3’ GEXCryopreserved cell suspension2-3 M cells
Cell viability > 70%
• Samples should be cryopreserved
with freezing media.
• Shipped in cryovials with dry ice.
Fresh
tissues/organoids
> 50 mg• Novogene will ship tissue storage
solution.
• Tissues must be placed in tissue
storage solution immediately after retrieval
and arrive in the lab within 48 hours.
• Shipped with ice packs.
Whole blood/Bone
marrow
(Mouse, Human, Rat)
2-4 mL
• Collected in EDTA vacutainer tubes.
• Shipped with ice packs.
snRNA-seq3’ GEXFresh frozen human/animal tissue or organoids> 50 mg• Shipped in cryovials with dry ice.
Fresh frozen plant tissue> 200 mg
sc/snRNA-seq10x Flex Gene Expression v2 (Apex)Fixed cell/nuclei suspension (Mouse, Human)≥ 500K fixed cells/sample
(minimum 320K cells/sample)
Sample viability ≥80% before fixation
• Cell dimeter: 5~30 μm
• Only stored at -80℃ up to 12months
• Provide ≥70μl Conc. • Quenching Buffer B per fixed sample
• Fix the cell/nuclei suspension following the 10x Genomics CG000782 Rev D protocol.
FFPE block (Mouse, Human)1 FFPE block
Tissue thickness > 1mm
• DV200 ≥ 30%
• After tissue dissociation, the nuclear count should ≥ 300K
FFPE section (Mouse, Human)Sample QC: 5-6 FFPE(5μm thickness) scrolls
Main experiment: 5-10 FFPE(10μm thickness) tissue rolls
• DV200 ≥ 30%
• After tissue dissociation, the nuclear count should ≥ 300K
*Contact us for species-specific recommendations and tissue type guidance.
**Sample type preferences may vary based on sequencing requirements and sample compatibility.

Sample Requirements

The quantities listed are provided for reference only. Please download the Sample Requirements for detailed guidance, or Contact us to discuss your project-specific requirements.

ServiceAssaySample Type**Recommended AmountOther details
scRNA-seq3’ GEXCryopreserved cell suspension2-3 M cells
Cell viability > 70%
• Samples should be cryopreserved
with freezing media.
• Shipped in cryovials with dry ice.
Fresh
tissues/organoids
> 50 mg• Novogene will ship tissue storage
solution.
• Tissues must be placed in tissue
storage solution immediately after retrieval
and arrive in the lab within 48 hours.
• Shipped with ice packs.
Whole blood/Bone
marrow
(Mouse, Human, Rat)
2-4 mL
• Collected in EDTA vacutainer tubes.
• Shipped with ice packs.
snRNA-seq3’ GEXFresh frozen human/animal tissue or organoids> 50 mg• Shipped in cryovials with dry ice.
Fresh frozen plant tissue> 200 mg
sc/snRNA-seq10x Flex Gene Expression v2 (Apex)Fixed cell/nuclei suspension (Mouse, Human)≥ 500K fixed cells/sample
(minimum 320K cells/sample)
Sample viability ≥80% before fixation
• Cell dimeter: 5~30 μm
• Only stored at -80℃ up to 12months
• Provide ≥70μl Conc. • Quenching Buffer B per fixed sample
• Fix the cell/nuclei suspension following the 10x Genomics CG000782 Rev D protocol.
FFPE block (Mouse, Human)1 FFPE block
Tissue thickness > 1mm
• DV200 ≥ 30%
• After tissue dissociation, the nuclear count should ≥ 300K
FFPE section (Mouse, Human)Sample QC: 5-6 FFPE(5μm thickness) scrolls
Main experiment: 5-10 FFPE(10μm thickness) tissue rolls
• DV200 ≥ 30%
• After tissue dissociation, the nuclear count should ≥ 300K
*Contact us for species-specific recommendations and tissue type guidance.
**Sample type preferences may vary based on sequencing requirements and sample compatibility.

Sample Requirements

The quantities listed are provided for reference only. Please download the Sample Requirements for detailed guidance, or Contact us to discuss your project-specific requirements.

ServiceAssaySample Type**Recommended AmountOther details
scRNA-seq3’ GEXCryopreserved cell suspension2-3 M cells
Cell viability > 70%
• Samples should be cryopreserved
with freezing media.
• Shipped in cryovials with dry ice.
Fresh
tissues/organoids
> 50 mg• Novogene will ship tissue storage
solution.
• Tissues must be placed in tissue
storage solution immediately after retrieval
and arrive in the lab within 48 hours.
• Shipped with ice packs.
Whole blood/Bone
marrow
(Mouse, Human, Rat)
2-4 mL
• Collected in EDTA vacutainer tubes.
• Shipped with ice packs.
snRNA-seq3’ GEXFresh frozen human/animal tissue or organoids> 50 mg• Shipped in cryovials with dry ice.
Fresh frozen plant tissue> 200 mg
sc/snRNA-seq10x Flex Gene Expression v2 (Apex)Fixed cell/nuclei suspension (Mouse, Human)≥ 500K fixed cells/sample
(minimum 320K cells/sample)
Sample viability ≥80% before fixation
• Cell dimeter: 5~30 μm
• Only stored at -80℃ up to 12months
• Provide ≥70μl Conc. • Quenching Buffer B per fixed sample
• Fix the cell/nuclei suspension following the 10x Genomics CG000782 Rev D protocol.
FFPE block (Mouse, Human)1 FFPE block
Tissue thickness > 1mm
• DV200 ≥ 30%
• After tissue dissociation, the nuclear count should ≥ 300K
FFPE section (Mouse, Human)Sample QC: 5-6 FFPE(5μm thickness) scrolls
Main experiment: 5-10 FFPE(10μm thickness) tissue rolls
• DV200 ≥ 30%
• After tissue dissociation, the nuclear count should ≥ 300K
*Contact us for species-specific recommendations and tissue type guidance.
**Sample type preferences may vary based on sequencing requirements and sample compatibility.

Sample Requirements

The quantities listed are provided for reference only. Please download the Sample Requirements for detailed guidance, or Contact us to discuss your project-specific requirements.

ServiceAssaySample Type**Recommended AmountOther details
scRNA-seq3’ GEXCryopreserved cell suspension2-3 M cells
Cell viability > 70%
• Samples should be cryopreserved
with freezing media.
• Shipped in cryovials with dry ice.
Fresh
tissues/organoids
> 50 mg• Novogene will ship tissue storage
solution.
• Tissues must be placed in tissue
storage solution immediately after retrieval
and arrive in the lab within 48 hours.
• Shipped with ice packs.
Whole blood/Bone
marrow
(Mouse, Human, Rat)
2-4 mL
• Collected in EDTA vacutainer tubes.
• Shipped with ice packs.
snRNA-seq3’ GEXFresh frozen human/animal tissue or organoids> 50 mg• Shipped in cryovials with dry ice.
Fresh frozen plant tissue> 200 mg
sc/snRNA-seq10x Flex Gene Expression v2 (Apex)Fixed cell/nuclei suspension (Mouse, Human)≥ 500K fixed cells/sample
(minimum 320K cells/sample)
Sample viability ≥80% before fixation
• Cell dimeter: 5~30 μm
• Only stored at -80℃ up to 12months
• Provide ≥70μl Conc. • Quenching Buffer B per fixed sample
• Fix the cell/nuclei suspension following the 10x Genomics CG000782 Rev D protocol.
FFPE block (Mouse, Human)1 FFPE block
Tissue thickness > 1mm
• DV200 ≥ 30%
• After tissue dissociation, the nuclear count should ≥ 300K
FFPE section (Mouse, Human)Sample QC: 5-6 FFPE(5μm thickness) scrolls
Main experiment: 5-10 FFPE(10μm thickness) tissue rolls
• DV200 ≥ 30%
• After tissue dissociation, the nuclear count should ≥ 300K
*Contact us for species-specific recommendations and tissue type guidance.
**Sample type preferences may vary based on sequencing requirements and sample compatibility.

Sequencing and Analysis

Recommended data outputs and analysis examples are provided for reference only. For detailed information, please  contact us to discuss your project-specific analysis requirements.

Sequencing PlatformIllumina NovaSeq X-Plus Sequencing Platform
Read LengthPaired-end 150 bp
Recommended Data3' & 5' GEX assay: 20,000 - 50,000 read pairs/cell, around 120Gb/sample
Flex Apex assay: 10,000 - 20,000 reads per recovered cell, corresponding to approximately 30 - 60 Gb/sample.
AnalysisCell Ranger AnalysisStandard Analysis
Demultiplex BCL files from a sequencer into FASTQs.
Summary metrics (sequencing quality, number of cells detected, the mean reads per cell, and the median genes detected per cell et al.).
Alignment of reads to genome.
Gene expression quantification.
Clustering analysis.
Differentially expression analysis between clusters.
Visualization.
Demultiplex BCL files from a sequencer into FASTQs.
Alignment, UMI counting, Metrics summary.
Identification of highly variable gene (HVGs).
Cell Subpopulation Identification.
Principal component analysis (PCA).
Identify clusters of cells.
Dimensionality reduction and Visualization.
Marker gene detection (Differentially expression analysis between clusters).
GO/KEGG/Reactome Enrichment.
FunctionalAnnotation of Transcription Factor.
Protein-Protein Interaction Network Analysis.

Sequencing and Analysis

Recommended data outputs and analysis examples are provided for reference only. For detailed information, please  contact us to discuss your project-specific analysis requirements.

Sequencing PlatformIllumina NovaSeq X-Plus Sequencing Platform
Read LengthPaired-end 150 bp
Recommended Data3' & 5' GEX assay: 20,000 - 50,000 read pairs/cell, around 120Gb/sample
Flex Apex assay: 10,000 - 20,000 reads per recovered cell, corresponding to approximately 30 - 60 Gb/sample.
AnalysisCell Ranger AnalysisStandard Analysis
Demultiplex BCL files from a sequencer into FASTQs.
Summary metrics (sequencing quality, number of cells detected, the mean reads per cell, and the median genes detected per cell et al.).
Alignment of reads to genome.
Gene expression quantification.
Clustering analysis.
Differentially expression analysis between clusters.
Visualization.
Demultiplex BCL files from a sequencer into FASTQs.
Alignment, UMI counting, Metrics summary.
Identification of highly variable gene (HVGs).
Cell Subpopulation Identification.
Principal component analysis (PCA).
Identify clusters of cells.
Dimensionality reduction and Visualization.
Marker gene detection (Differentially expression analysis between clusters).
GO/KEGG/Reactome Enrichment.
FunctionalAnnotation of Transcription Factor.
Protein-Protein Interaction Network Analysis.

Sequencing and Analysis

Recommended data outputs and analysis examples are provided for reference only. For detailed information, please  contact us to discuss your project-specific analysis requirements.

Sequencing PlatformIllumina NovaSeq X-Plus Sequencing Platform
Read LengthPaired-end 150 bp
Recommended Data3' & 5' GEX assay: 20,000 - 50,000 read pairs/cell, around 120Gb/sample
Flex Apex assay: 10,000 - 20,000 reads per recovered cell, corresponding to approximately 30 - 60 Gb/sample.
AnalysisCell Ranger AnalysisStandard Analysis
Demultiplex BCL files from a sequencer into FASTQs.
Summary metrics (sequencing quality, number of cells detected, the mean reads per cell, and the median genes detected per cell et al.).
Alignment of reads to genome.
Gene expression quantification.
Clustering analysis.
Differentially expression analysis between clusters.
Visualization.
Demultiplex BCL files from a sequencer into FASTQs.
Alignment, UMI counting, Metrics summary.
Identification of highly variable gene (HVGs).
Cell Subpopulation Identification.
Principal component analysis (PCA).
Identify clusters of cells.
Dimensionality reduction and Visualization.
Marker gene detection (Differentially expression analysis between clusters).
GO/KEGG/Reactome Enrichment.
FunctionalAnnotation of Transcription Factor.
Protein-Protein Interaction Network Analysis.

Sequencing and Analysis

Recommended data outputs and analysis examples are provided for reference only. For detailed information, please  contact us to discuss your project-specific analysis requirements.

Sequencing PlatformIllumina NovaSeq X-Plus Sequencing Platform
Read LengthPaired-end 150 bp
Recommended Data3' & 5' GEX assay: 20,000 - 50,000 read pairs/cell, around 120Gb/sample
Flex Apex assay: 10,000 - 20,000 reads per recovered cell, corresponding to approximately 30 - 60 Gb/sample.
AnalysisCell Ranger AnalysisStandard Analysis
Demultiplex BCL files from a sequencer into FASTQs.
Summary metrics (sequencing quality, number of cells detected, the mean reads per cell, and the median genes detected per cell et al.).
Alignment of reads to genome.
Gene expression quantification.
Clustering analysis.
Differentially expression analysis between clusters.
Visualization.
Demultiplex BCL files from a sequencer into FASTQs.
Alignment, UMI counting, Metrics summary.
Identification of highly variable gene (HVGs).
Cell Subpopulation Identification.
Principal component analysis (PCA).
Identify clusters of cells.
Dimensionality reduction and Visualization.
Marker gene detection (Differentially expression analysis between clusters).
GO/KEGG/Reactome Enrichment.
FunctionalAnnotation of Transcription Factor.
Protein-Protein Interaction Network Analysis.

Resources

Example Analysis Output

Image
Image
1/1
UMAP Clustering

Compare the relative abundance of annotated cell types across samples or study groups.

Image
Image
1/1
Cell Type Composition

Compare the relative abundance of annotated cell types across samples or study groups.

Image
Image
1/1
Cell State Potential

Assess predicted cell-state patterns to support interpretation of cellular transitions and functional heterogeneity.

Image
Image
1/1
Cell-type t-SNE

Display annotated cell populations using t-SNE visualisation to support cell-type identification and exploratory analysis.

Image
Image
1/1
Marker Gene Enrichment

Identify enriched pathways or functional categories associated with marker genes from selected cell clusters.

Image
Image
1/1
Marker Gene Expression

Visualise marker gene expression across cell groups to support cluster annotation and biological interpretation.

Image
Image
1/1
UMAP Clustering

Compare the relative abundance of annotated cell types across samples or study groups.

Image
Image
1/1
Cell Type Composition

Compare the relative abundance of annotated cell types across samples or study groups.

Image
Image
1/1
Cell State Potential

Assess predicted cell-state patterns to support interpretation of cellular transitions and functional heterogeneity.

Image
Image
1/1
Cell-type t-SNE

Display annotated cell populations using t-SNE visualisation to support cell-type identification and exploratory analysis.

Image
Image
1/1
Marker Gene Enrichment

Identify enriched pathways or functional categories associated with marker genes from selected cell clusters.

Image
Image
1/1
Marker Gene Expression

Visualise marker gene expression across cell groups to support cluster annotation and biological interpretation.

Resources

Example Analysis Output

Image
Image
1/1
UMAP Clustering

Compare the relative abundance of annotated cell types across samples or study groups.

Image
Image
1/1
Cell Type Composition

Compare the relative abundance of annotated cell types across samples or study groups.

Image
Image
1/1
Cell State Potential

Assess predicted cell-state patterns to support interpretation of cellular transitions and functional heterogeneity.

Image
Image
1/1
Cell-type t-SNE

Display annotated cell populations using t-SNE visualisation to support cell-type identification and exploratory analysis.

Image
Image
1/1
Marker Gene Enrichment

Identify enriched pathways or functional categories associated with marker genes from selected cell clusters.

Image
Image
1/1
Marker Gene Expression

Visualise marker gene expression across cell groups to support cluster annotation and biological interpretation.

Image
Image
1/1
UMAP Clustering

Compare the relative abundance of annotated cell types across samples or study groups.

Image
Image
1/1
Cell Type Composition

Compare the relative abundance of annotated cell types across samples or study groups.

Image
Image
1/1
Cell State Potential

Assess predicted cell-state patterns to support interpretation of cellular transitions and functional heterogeneity.

Image
Image
1/1
Cell-type t-SNE

Display annotated cell populations using t-SNE visualisation to support cell-type identification and exploratory analysis.

Image
Image
1/1
Marker Gene Enrichment

Identify enriched pathways or functional categories associated with marker genes from selected cell clusters.

Image
Image
1/1
Marker Gene Expression

Visualise marker gene expression across cell groups to support cluster annotation and biological interpretation.

Webinars

Unravel biological complexity with streamlined single cell solution

Discover how single-cell sequencing can reveal cellular heterogeneity, identify rare cell populations, and uncover molecular mechanisms within complex tissues. This webinar will explore 10x Genomics Chromium Single Cell solutions, key research applications, and best practices for generating and analysing high-quality single-cell data.

Learn More
(Unravel biological complexity with streamlined single cell solution)
Unravel biological complexity with streamlined single cell solution

Discover how single-cell sequencing can reveal cellular heterogeneity, identify rare cell populations, and uncover molecular mechanisms within complex tissues. This webinar will explore 10x Genomics Chromium Single Cell solutions, key research applications, and best practices for generating and analysing high-quality single-cell data.

Learn More
(Unravel biological complexity with streamlined single cell solution)
Unravel biological complexity with streamlined single cell solution

Discover how single-cell sequencing can reveal cellular heterogeneity, identify rare cell populations, and uncover molecular mechanisms within complex tissues. This webinar will explore 10x Genomics Chromium Single Cell solutions, key research applications, and best practices for generating and analysing high-quality single-cell data.

Learn More
(Unravel biological complexity with streamlined single cell solution)
Unravel biological complexity with streamlined single cell solution

Discover how single-cell sequencing can reveal cellular heterogeneity, identify rare cell populations, and uncover molecular mechanisms within complex tissues. This webinar will explore 10x Genomics Chromium Single Cell solutions, key research applications, and best practices for generating and analysing high-quality single-cell data.

Learn More
(Unravel biological complexity with streamlined single cell solution)
Getting More from Single-Cell Sequencing with 10x Genomics GEM-X

Explore the latest advances in 10x Genomics GEM-X technology, including 3′ and 5′ gene expression workflows, improved assay performance and practical considerations for sample preparation, experimental design and data analysis.

Learn More
(Getting More from Single-Cell Sequencing with 10x Genomics GEM-X)
Getting More from Single-Cell Sequencing with 10x Genomics GEM-X

Explore the latest advances in 10x Genomics GEM-X technology, including 3′ and 5′ gene expression workflows, improved assay performance and practical considerations for sample preparation, experimental design and data analysis.

Learn More
(Getting More from Single-Cell Sequencing with 10x Genomics GEM-X)
Getting More from Single-Cell Sequencing with 10x Genomics GEM-X

Explore the latest advances in 10x Genomics GEM-X technology, including 3′ and 5′ gene expression workflows, improved assay performance and practical considerations for sample preparation, experimental design and data analysis.

Learn More
(Getting More from Single-Cell Sequencing with 10x Genomics GEM-X)
Getting More from Single-Cell Sequencing with 10x Genomics GEM-X

Explore the latest advances in 10x Genomics GEM-X technology, including 3′ and 5′ gene expression workflows, improved assay performance and practical considerations for sample preparation, experimental design and data analysis.

Learn More
(Getting More from Single-Cell Sequencing with 10x Genomics GEM-X)

Frequently Asked Questions

What is the difference between 3′, 5′ and Flex single-cell gene expression?

What species are suitable for 10x Genomics 3′ gene expression?

Our 3′ gene expression workflows support a range of eukaryotic species. For plant samples, Novogene Europe currently offers a single-nucleus RNA-seq workflow. Project suitability depends on species, sample type and study requirements.

What sample types can be used for single-cell gene expression?

When should I consider single-nucleus rather than single-cell RNA sequencing?

How should samples be shipped for single-cell gene expression analysis?

Explore Single-cell & Spatial Resources

Access webinars, brochures and case studies covering sequencing technologies, study planning and data interpretation.
View Webinar Library
(Explore Single-cell & Spatial Resources)
View Webinar Library
(Explore Single-cell & Spatial Resources)
Background
Background

Speak with a Specialist

Have a project in mind?


Send us your enquiry and a Novogene Europe specialist will be in touch.


Privacy PolicyCookie PolicyTerms